Fragment analysis results
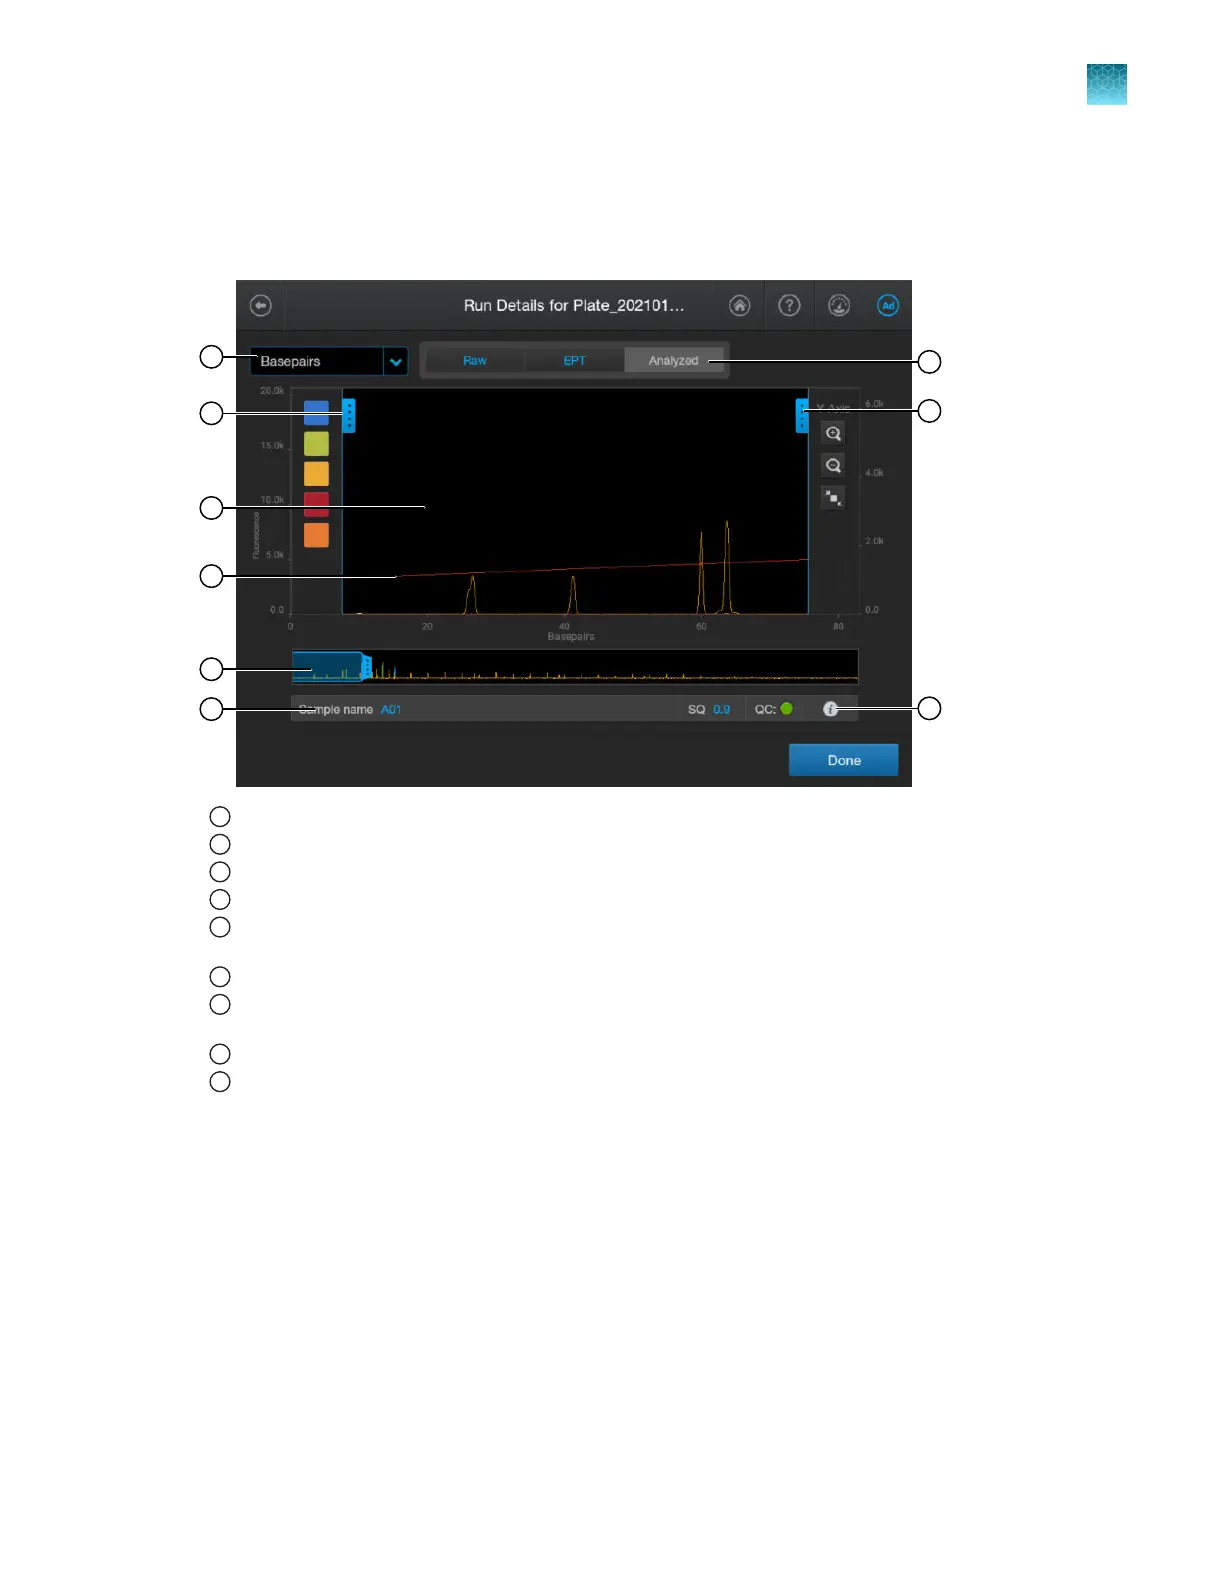
Parts of the fragment analysis electropherogram screen
1
Basepair or scan display selection.
2
Trace color hide/show—Tap to open, then tap a color to hide or show.
3
Analyzed trace. By default, the low-base pair size region is selected and the size standard trace is visible.
4
Size standard curve (red line).
5
Thumbnail trace—Drag the center of the pane in the thumbnail trace to display another trace area in the top pane.
Dr
ag the right or left handle of the pane to zoom horizontally.
6
Sample name and results. See “Fragment analysis results and well details” on page 180.
7
Trace tab—Tap to view the raw, EPT, or analyzed trace for the well. If the trace is blank, press-drag the thumbnail
pane over the r
egion of data to view.
8
Zoom tools—Tap to open.
9
Well details—Tap to display well details. See “Fragment analysis results and well details” on page 180.
Chapter 7 View results on the instrument
Fragment analysis results
7
SeqStudio
™
Flex Series Genetic Analyzer with Instrument Software v1.0 User Guide
179