Sequence analysis results
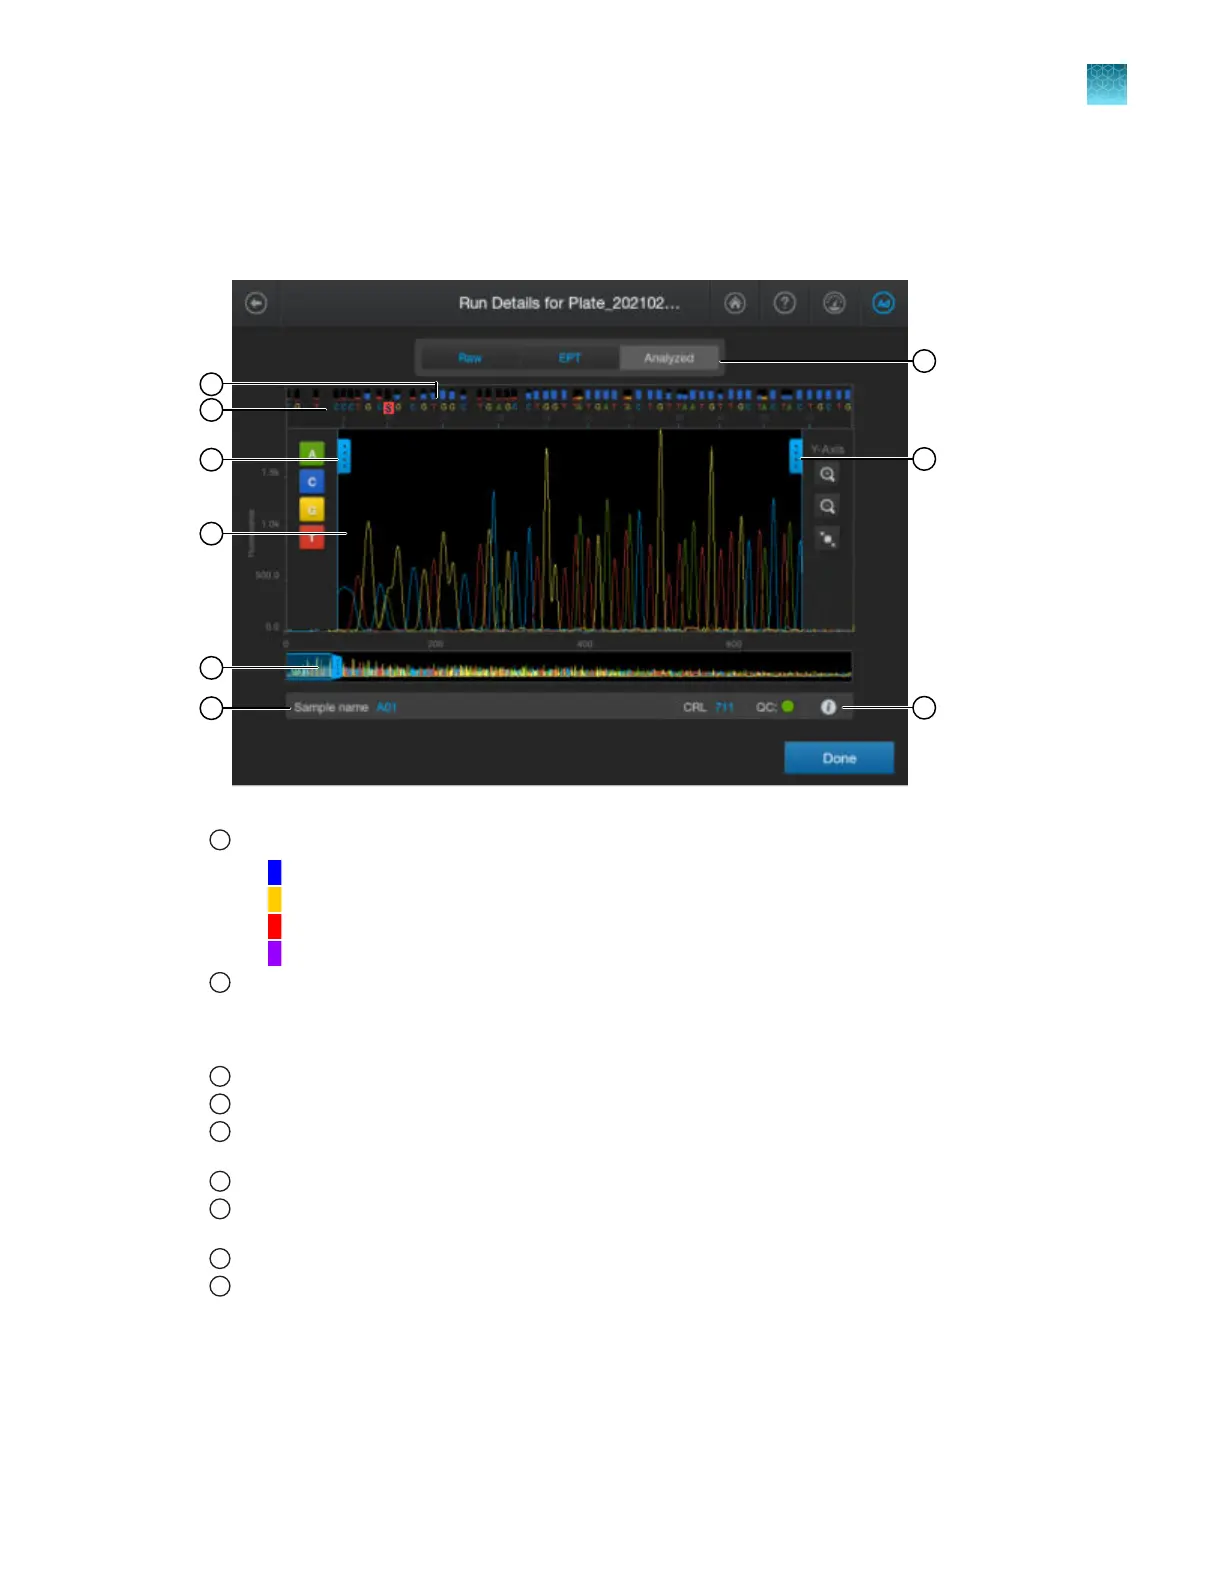
Parts of the sequencing electropherogram screen
1
Quality Value bars. For more information, see “Understanding Quality Values (QVs)” on page 178.
•
Pure basecall with QV ≥20
•
Pure basecall with QV 15–19
•
Pure basecall with QV <15
•
Mixed basecall
2
Basecalls—The background of a mixed basecall is flagged in r
ed. You can set the secondary peak threshold, as
a percentage of the primary peak, for consideration as a mixed basecall by the basecalling algorithm. Reaching
this threshold is a necessary but not sucient condition for arriving at a mixed base determination. See “Analysis
settings—Sequencing” on page 291.
3
Trace color hide/show—Tap to open, then tap a color to hide or show.
4
Analyzed trace.
5
Thumbnail trace—Drag the center of the pane in the thumbnail trace to display another trace area in the top pane.
Dr
ag the right or left handle of the pane to zoom horizontally.
6
Sample name and result summary. See “Sequencing results and well details” on page 176.
7
Trace tab—Tap to view the raw, EPT, or analyzed trace for the well. If the raw trace is blank, press-drag the thumbnail
pane over the r
egion of data to view.
8
Zoom tools—Tap to open.
9
Well details—Tap to display well details. See “Sequencing results and well details” on page 176.
Chapter 7 View results on the instrument
Sequence analysis results
7
SeqStudio
™
Flex Series Genetic Analyzer with Instrument Software v1.0 User Guide
175