3.
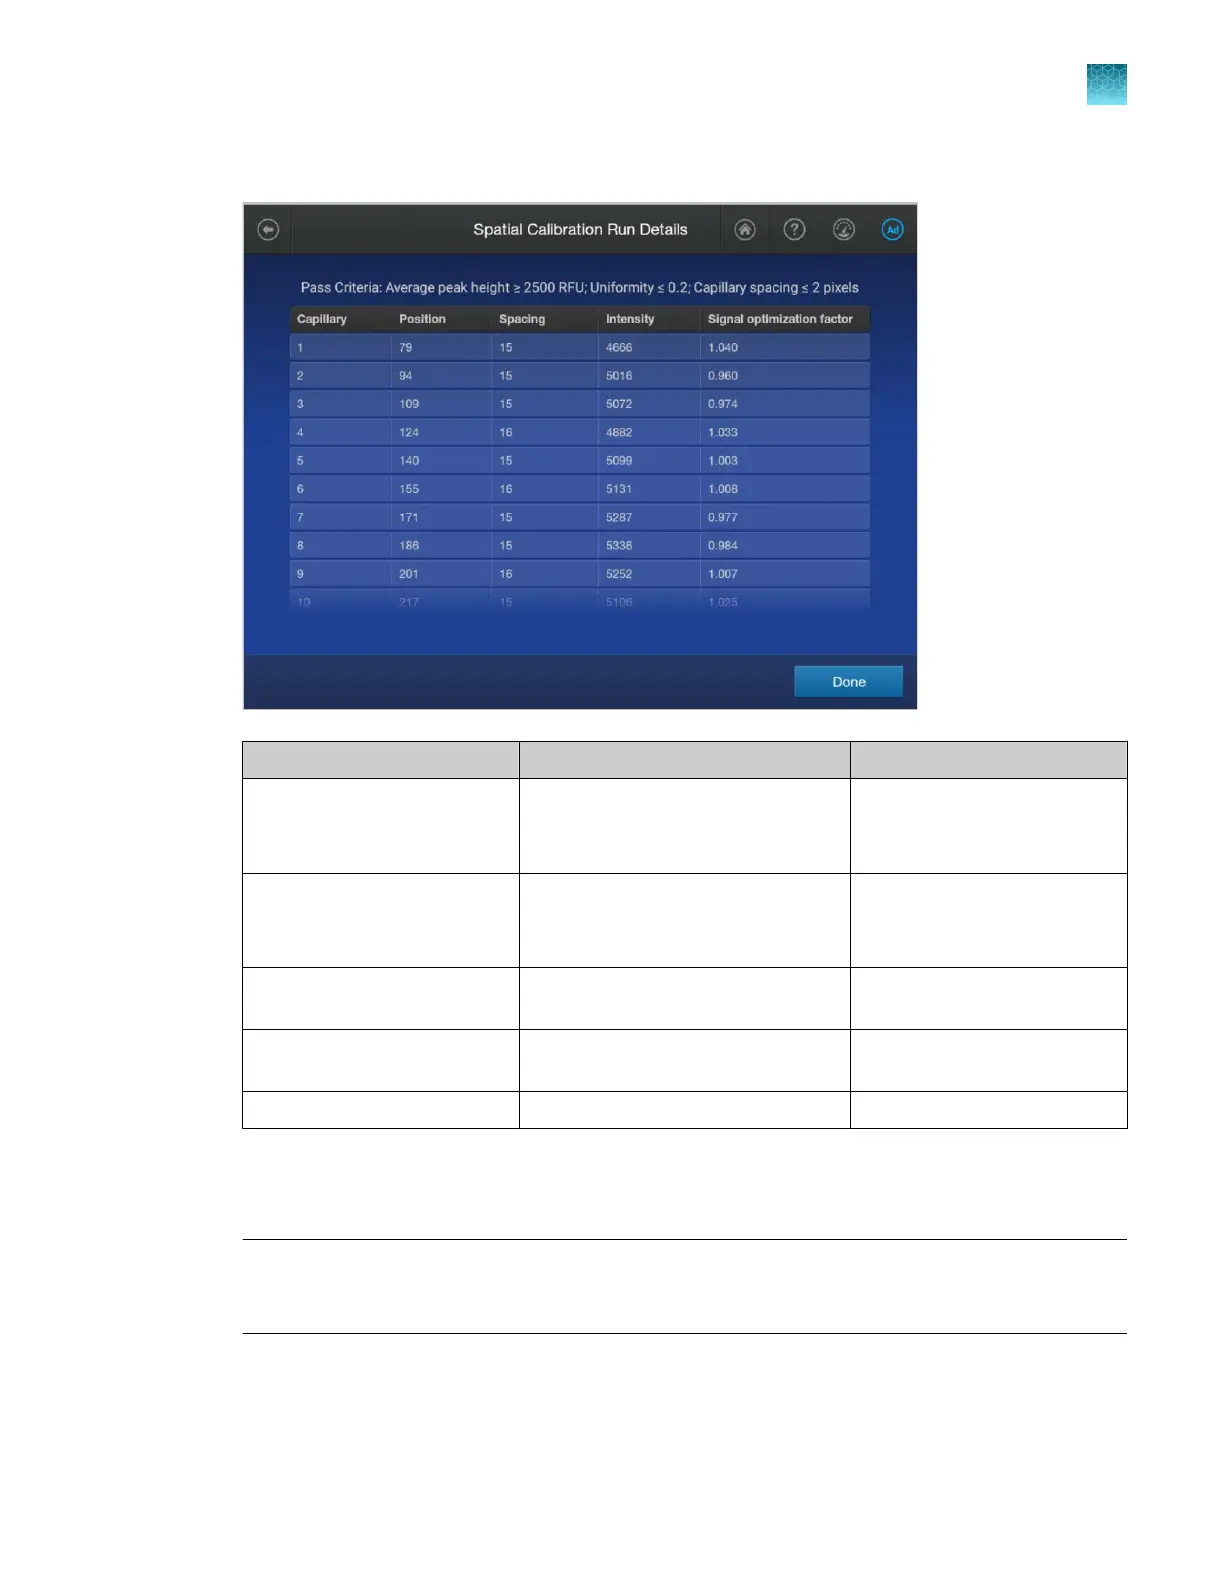
Tap View details to view the results for each capillary.
Attribute Calculation Threshold
Average peak height (sum of all peak heights)
divided by
(number of peaks)
•
8-cap: ≥6,400 RFU
•
24-cap: ≥2,500 RFU
Uniformity (peak height
similarity)
(standard deviation)
divided by
(aver
age peak height)
0.2
Spacing (capillary spacing) Maximum spacing – minimum
spacing
2 pixels
Intensity (individual peak
height)
Peak height 1,000 RFU
Signal optimization factor Described below —
Fragment analysis on 24-capillary instruments only: A signal optimization fact
or is calculated
for each capillary during spatial calibration. The factor for each capillary is applied during data
collection to minimize optical variation eects and to increase signal uniformity between capillaries.
Note: The signal optimization factor is calculated using a fitted curve method. The fitted curve
method minimizes background and reduces noise. The adjusted spatial intensity, not the spatial
intensity displayed for the capillary, is used to calculate the signal optimization factor.
4.
T
ap Done.
Chapter 12 Run calibr
ations and install checks
Run a spatial calibration
12
SeqStudio
™
Flex Series Genetic Analyzer with Instrument Software v1.0 User Guide
307