3.
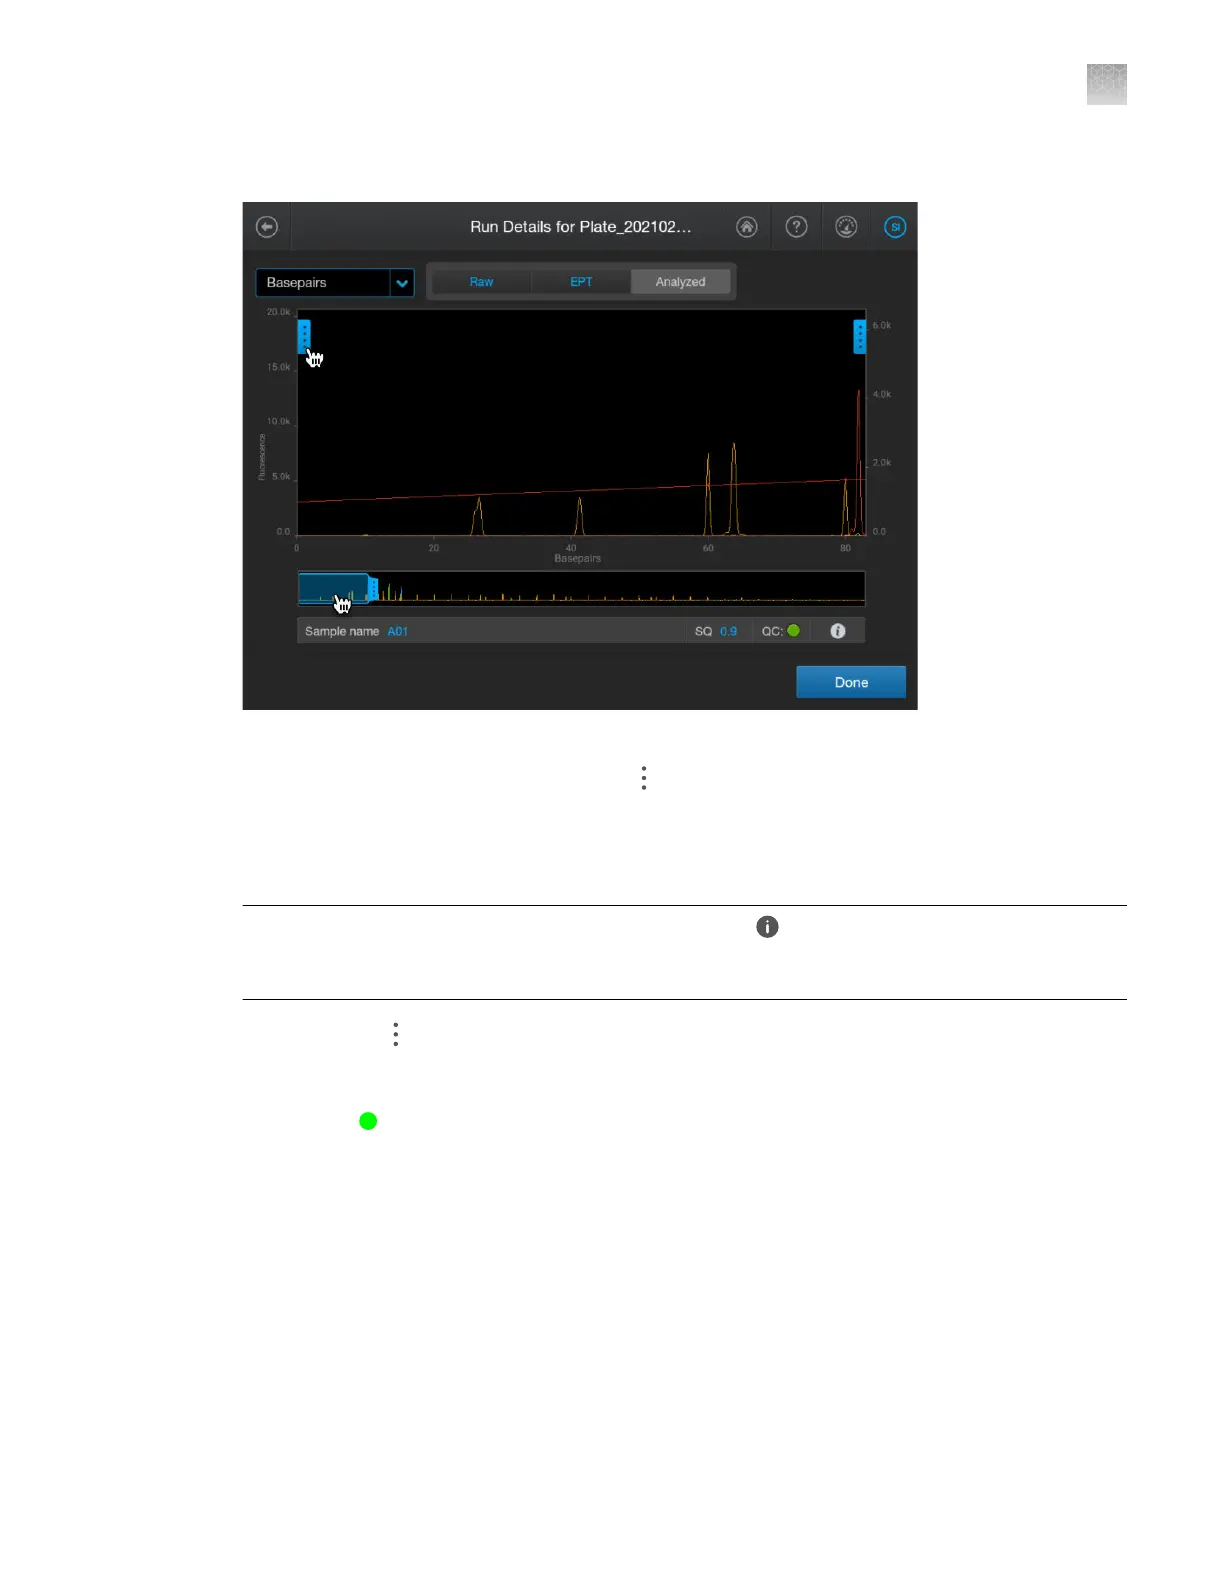
Tap a well, then tap View.
By default, the Analyz
ed tab is selected and the size standard peaks are shown. If the size
standard peaks are not visible, you can tap
on the left border of the trace, then deselect all
dyes e
xcept the size standard dye (red or orange). You can also move the thumbnail window to the
size standard peak region.
4.
Ensure that all expected peaks are detected.
Note: To determine the size standard that was used, tap
(Information). T
o determine the
expected peaks, view the size standard in the size standard library. See “Size standards library” on
page 275.
5.
As needed, tap on the right border of the trace to zoom.
Example of a size standard electropherogram
The results show
Sample QC status, SQ 0.86.
Although no aler
ts were triggered, the low SQ should be investigated. In this example, the low SQ is
caused by the issues with peak resolution later in the electropherogram.
Appendix A T
roubleshooting
Inspect the data—Troubleshooting procedures
A
SeqStudio
™
Flex Series Genetic Analyzer with Instrument Software v1.0 User Guide
477