2.
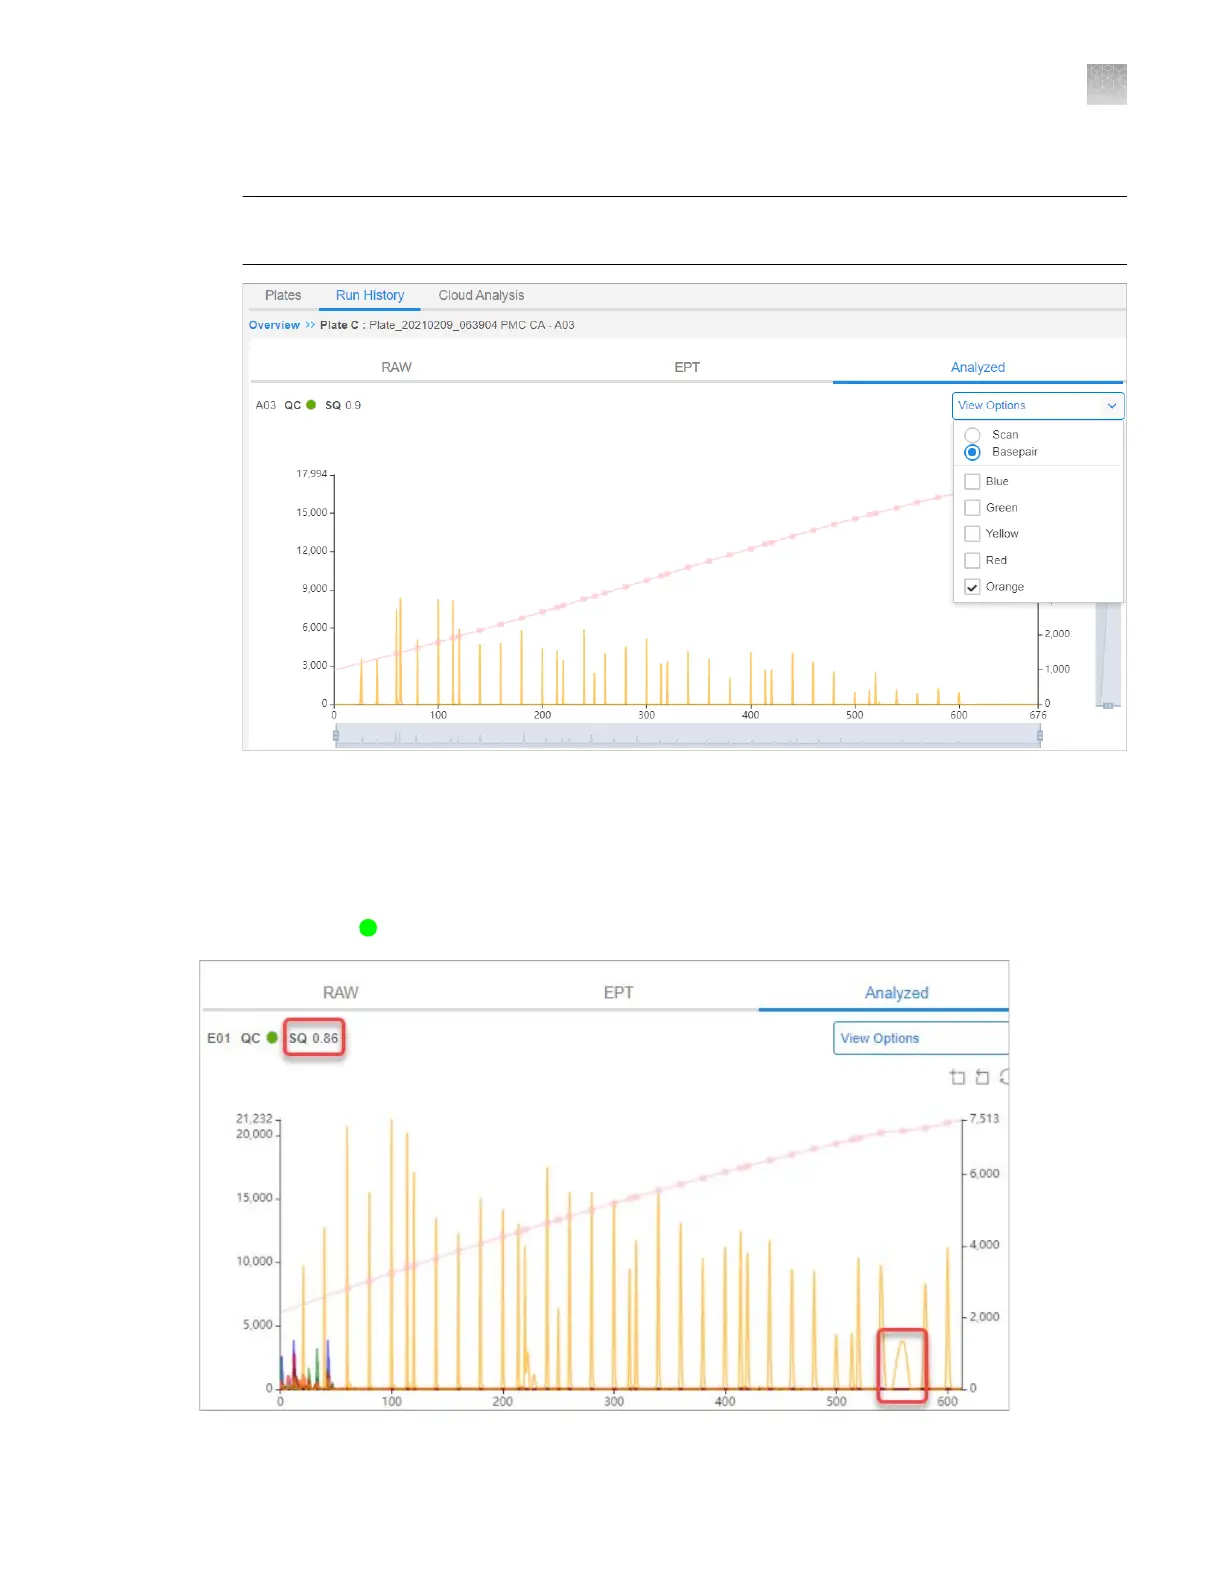
Select a sample to investigate, then click the Analyzed tab.
Note: The Analyzed tab is blank if the analysis is not complete or if the results were not saved to
Thermo Fisher
™
Connect.
3.
Click V
iew Options, then deselect all dyes except the size standard dye.
4.
Ensure that all expected peaks are detected.
Example of a size standard electropherogram
The results show
Sample QC status, SQ 0.86.
Appendix A Troubleshooting
Inspect the data—Troubleshooting procedures
A
SeqStudio
™
Flex Series Genetic Analyzer with Instrument Software v1.0 User Guide
479