6.
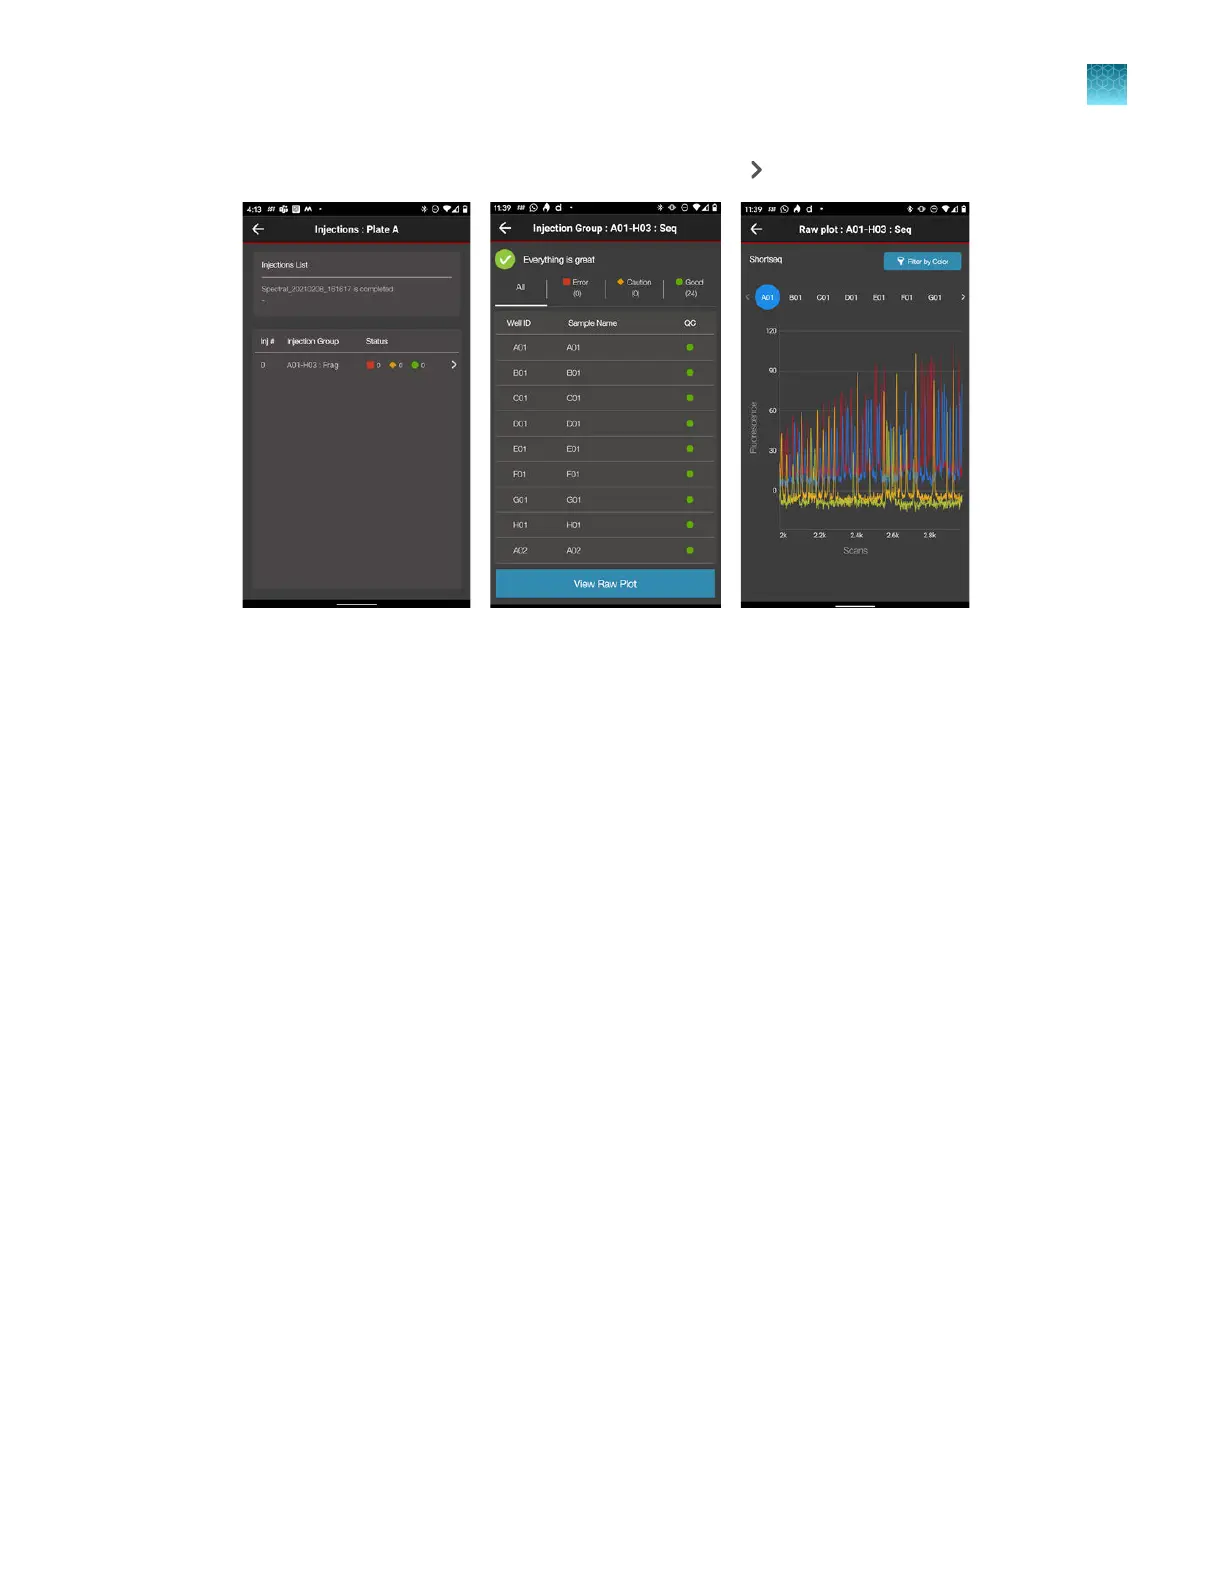
Tap a plate position to display the injection list, then tap to display the well list.
7.
T
ap a well, then tap View Raw Plot to display the electropherogram.
•
Swipe left to view the entire trace.
•
Pinch‑zoom to expand the trace.
Chapter 8 Use the Remot
e Monitoring software to monitor runs, view results, and use cloud analysis
Monitor a run from a mobile device
8
SeqStudio
™
Flex Series Genetic Analyzer with Instrument Software v1.0 User Guide
197