Table 13 (Information) details screen—sequencing install run
Result Description
Sample file name,
Sample name, and
Capillary number
Identification for the results.
QC
(This result is referred
to as Install QC on the
Capillaries tab.)
The Install QC result described above.
CRL
(This result is referred to
as QV20 CRL on the
Capillaries tab.)
The QV20 CRL result described above.
Signal strength The average signal Intensity in the raw data.
QV20 The total number of bases in the sequence with a QV≥20.
Median PUP A measure of noise or pull-up that is determined by taking the mean of the ratios
of signal strength calculated for each basecalled peak: primary peak/secondary
peak under the primary peak.
A higher value indicates less baseline or secondary noise. A lower value
indicates an elevated baseline or secondary noise.
Example 1: Main called base signal strength is 1,000 RFU and the largest
secondary peak beneath it is 10 RFU; PUP=100
Example 2: Main called base signal strength is 1,000 RFU and the largest
secondary peak beneath it is 100 RFU; PUP=10
Trace score The average basecall Quality Value (QV) of basecalls in the clear range sequence
of a trace.
The clear range is the region of the sequence that remains after excluding the
low-quality or error-prone sequence at the 5′ and 3′ ends. The clear range is
calculated by the KB Basecaller using QVs.
Run module, Dye set,
and Analysis settings
name
The settings from the plate file that were used to collect and analyze the data.
Spectral calibration
status
For information, see “Auto-spectral calibration during an injection” on page 150.
Chapter 12 Run calibrations and install checks
Perform an install run
12
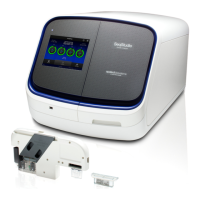
SeqStudio
™
Flex Series Genetic Analyzer with Instrument Software v1.0 User Guide
343