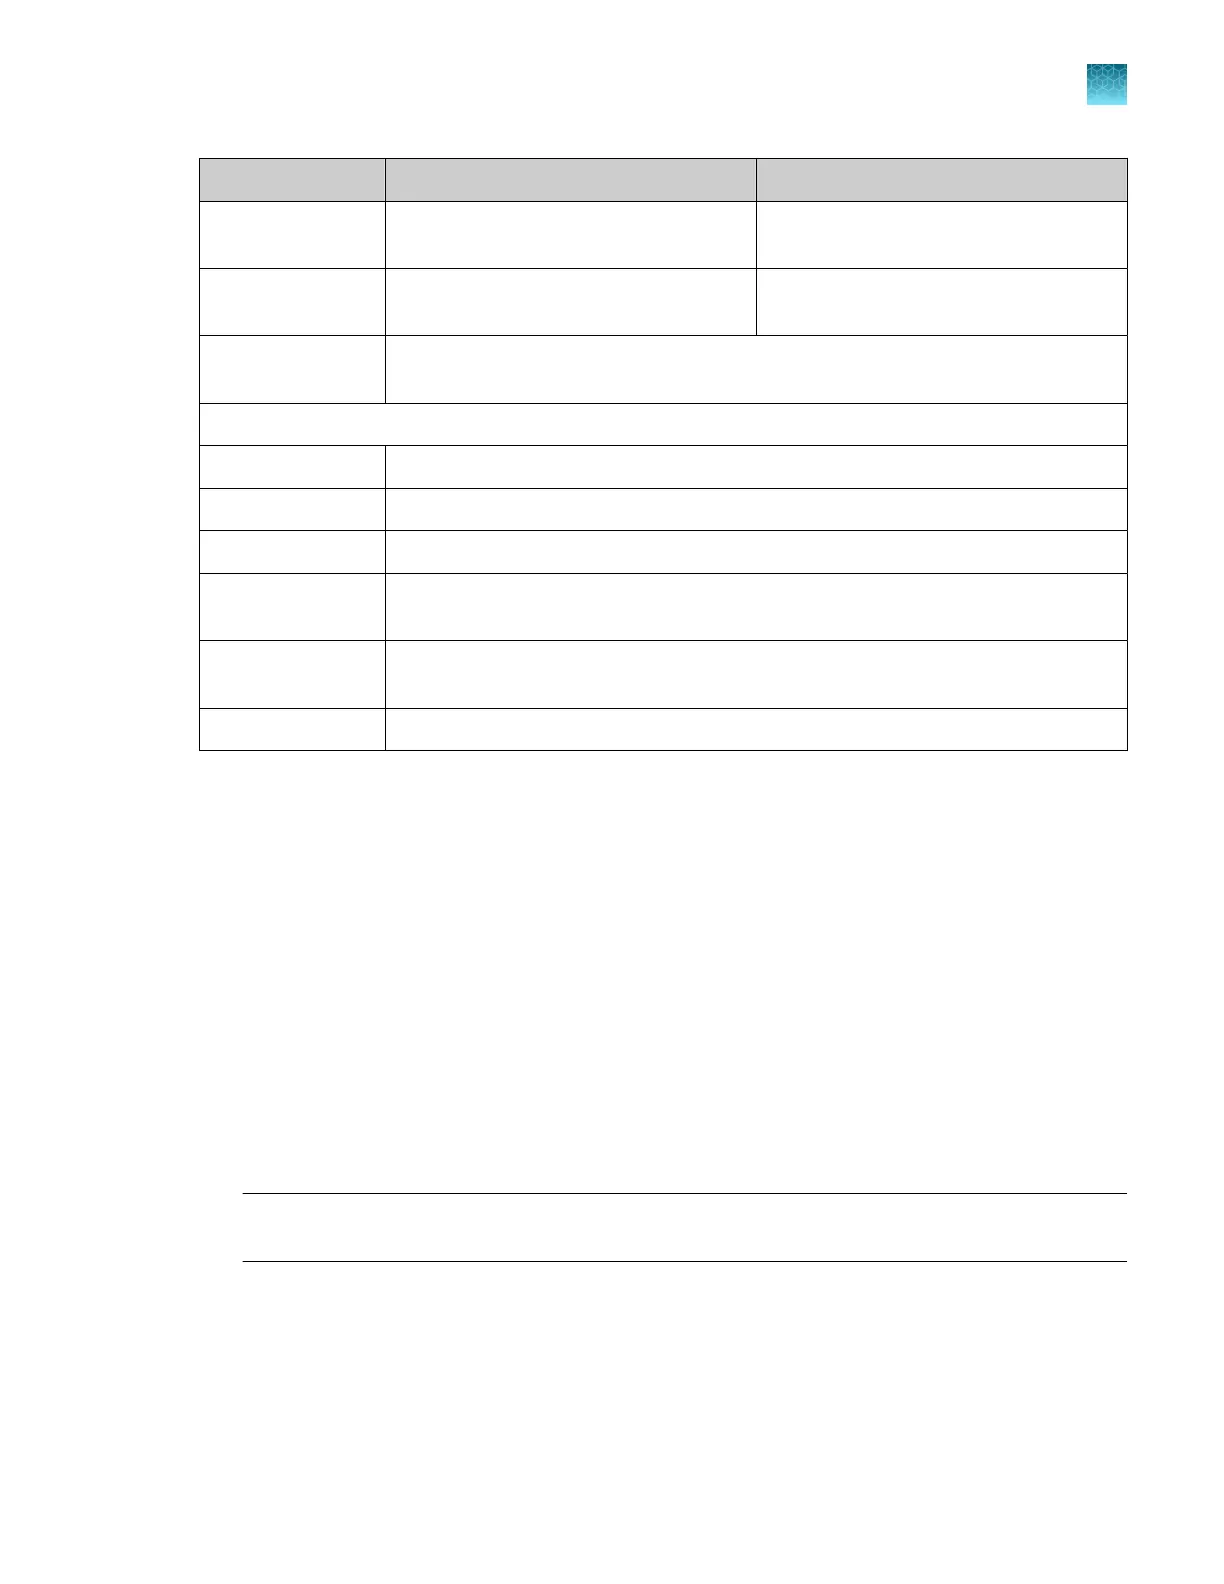
Result Description Threshold
Min Peak Height Minimum of peak heights for observed
allele peaks of the included capillaries.
>175 RFU
Sizing precision Standard deviation of the observed allele
fragment sizes
<0.15 for expected alleles
Pass/Fail Alleles with a sizing precision and minimum peak height that do not meet thresholds
fail.
For information only
Nominal Size Expected allele fragment peak size (bp).
Mean size Average fragment size for the observed allele peaks.
Mean peak height Average peak height for the observed allele peaks.
Peak Height % >
Min
Percentage of observed allele peaks with a peak height above the minimum
threshold.
Sizing Precision Standard deviation of the observed allele fragment sizes vs the expected fragment
sizes.
Sizing Accuracy Dierence between the expected allele size and the mean allele size.
Export fragment analysis install run logs or report
1.
In the plot screen or the results per capillary screen, tap Actions.
2.
Tap the item to export:
•
Logs (ZIP)—Contains the install run report (PDF), data files (FSA), peak tables (CSV), install run
file (CID), and log files.
Log file name format: InstrumentName_Fragment Analysis_RunDate_Timestamp.zip,
for example: Instrument1_Fragment Analysis_20201021_121952.zip
•
Report (PDF)— Contains the results of the install run.
Report file name format: InstrumentName_Fragment
Analysis_RunDate_Timestamp.pdf, for example: Instrument1_Fragment
Analysis_20201021_121952.pdf
3.
Select the export location, then tap Next.
Note: It can take up to 15 seconds for the instrument to recognize a USB drive after the drive is
inserted in a USB port. exFAT-formatted USB drives are recommended.
For information on connecting to a network drive, see “Connect the software to a network drive
(softwar
e settings)” on page 443.
4.
When the export is complete, click Close to close the message box.
Chapter 12 Run calibr
ations and install checks
Perform an install run
12
SeqStudio
™
Flex Series Genetic Analyzer with Instrument Software v1.0 User Guide
351