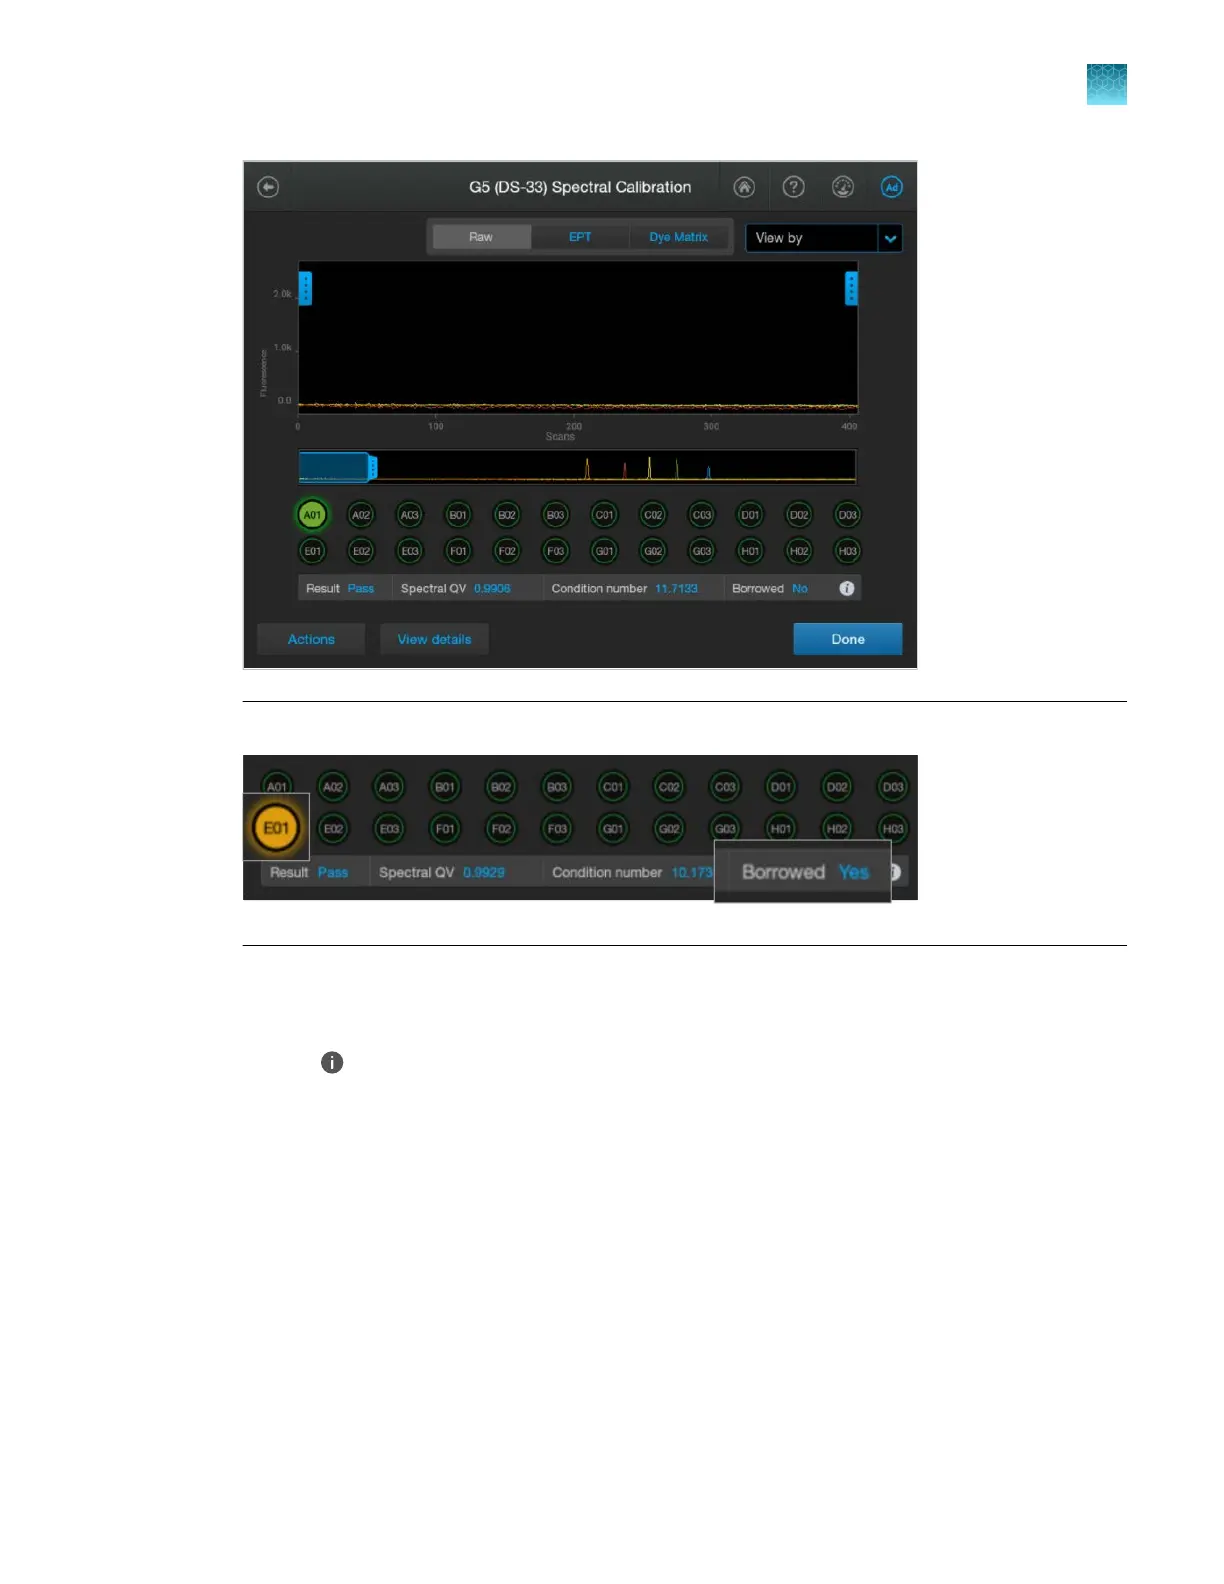
Note: W
ells with borrowed spectral calibration are flagged in yellow (caution).
In this screen, you can:
•
T
ap a well to view the results for the well. The results for the well are displayed below the well
positions.
•
Tap
to display the file name for the well.
•
T
ap the Raw, EPT, or Dye Matrix tab to display dierent views of the data.
•
Tap Actions, then tap Pause instrument, Export logs, or Export report.
•
Tap View details to display the details for each well.
For more information, see “Use the electropherogram screen” on page 173.
3.
Tap View details to display the details for each capillary.
For a description of results, see “Spectral QV (quality value) and Condition number definitions and
limits” on page 320 and “Spectral calibration sharing between capillaries” on page 321.
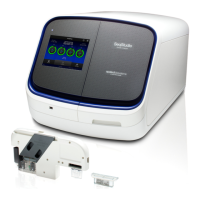
Chapter 12 Run calibr
ations and install checks
Run a spectral calibration
12
SeqStudio
™
Flex Series Genetic Analyzer with Instrument Software v1.0 User Guide
319
 Loading...