For a description of the results on this screen, see “Capillaries tab—sequencing install run” on
page 341.
6.
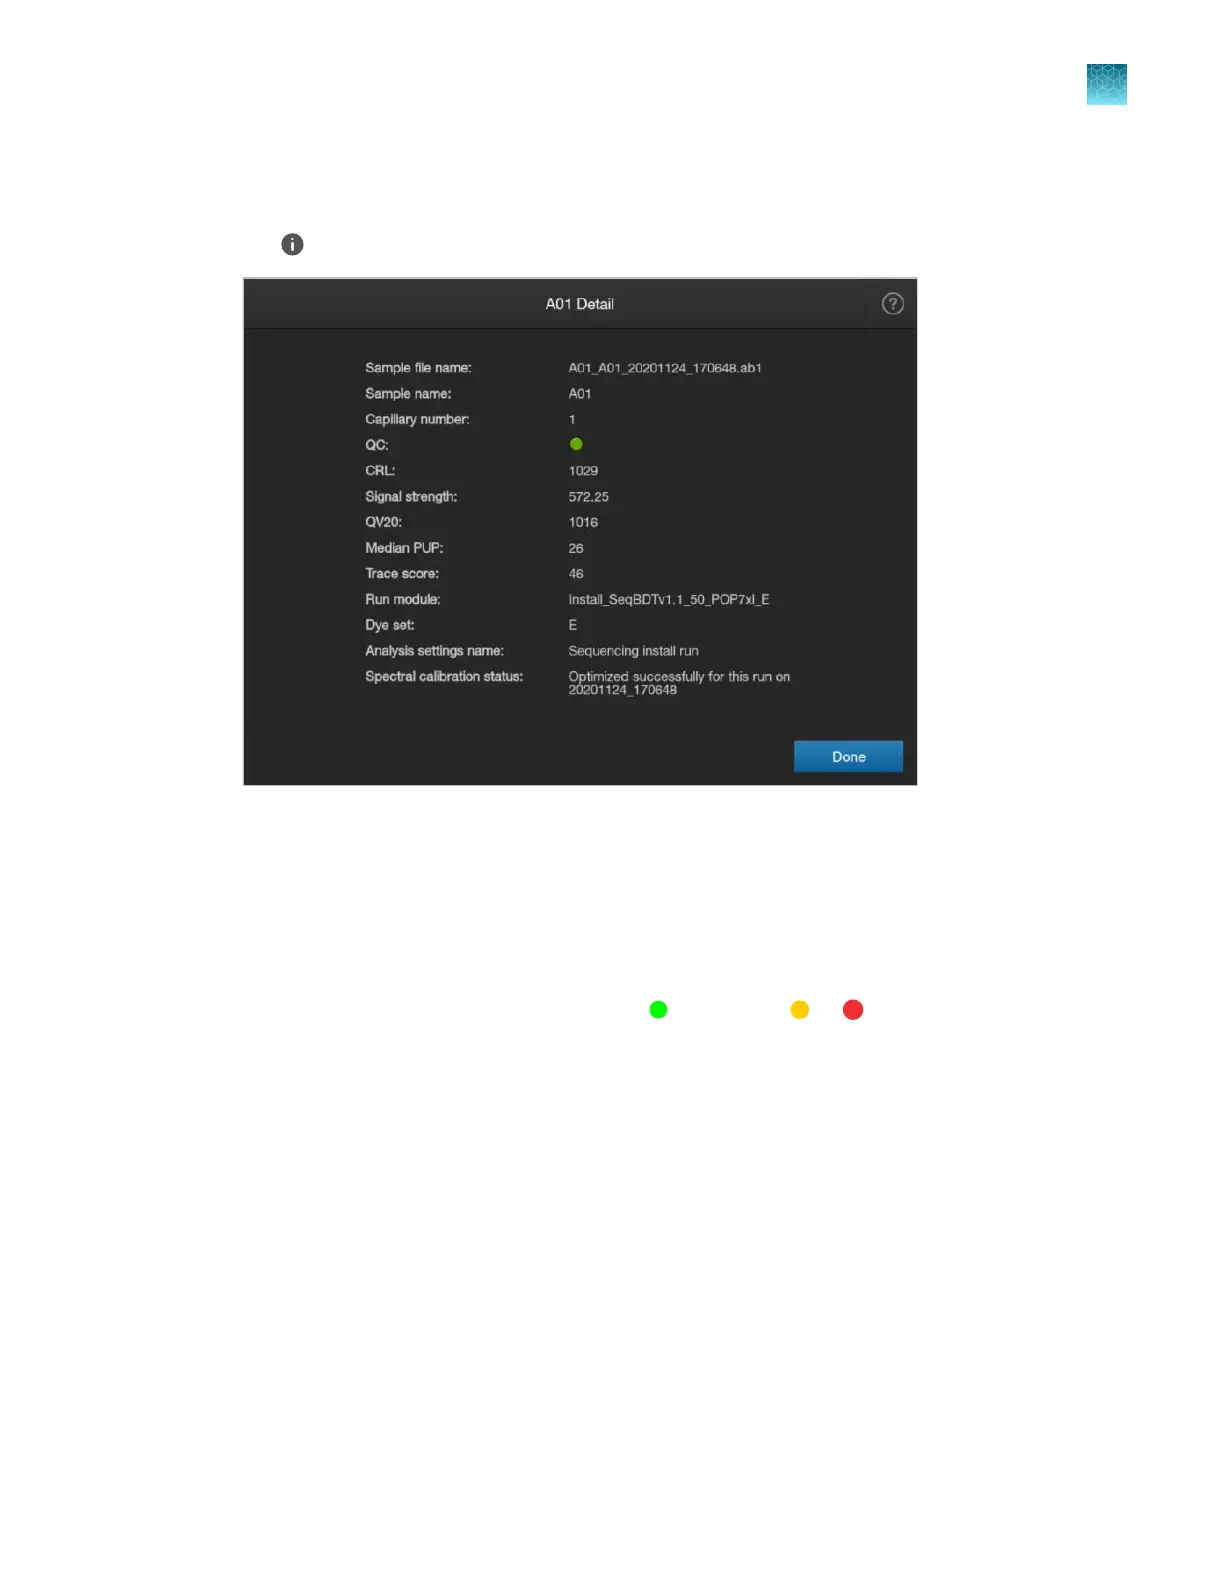
Tap (Information) t
o display the details for a capillary.
For a description of the results on this screen, see “Details screen—sequencing install run” on
page 342.
7.
T
ap Done to return to the Capillaries tab.
8.
Tap View plot in the Summary tab or the Capillaries tab to display the plot for each capillary
(Raw, Analyzed, and Sequencing tabs are shown below).
You can tap View by to filter results by Pass (
) or Flagged (
or ).
F
or a description of the results on this screen, see “Plot view—sequencing install run” on
page 344.
For more information, see “Use the electropherogram screen” on page 173.
Chapter 12 Run calibr
ations and install checks
Perform an install run
12
SeqStudio
™
Flex Series Genetic Analyzer with Instrument Software v1.0 User Guide
337