-SCS Parameter Analyzer Reference Manual Appendix D: Using a Model 82 C-V Sys
4200A-901-01 Rev. C / February 2017 D-53
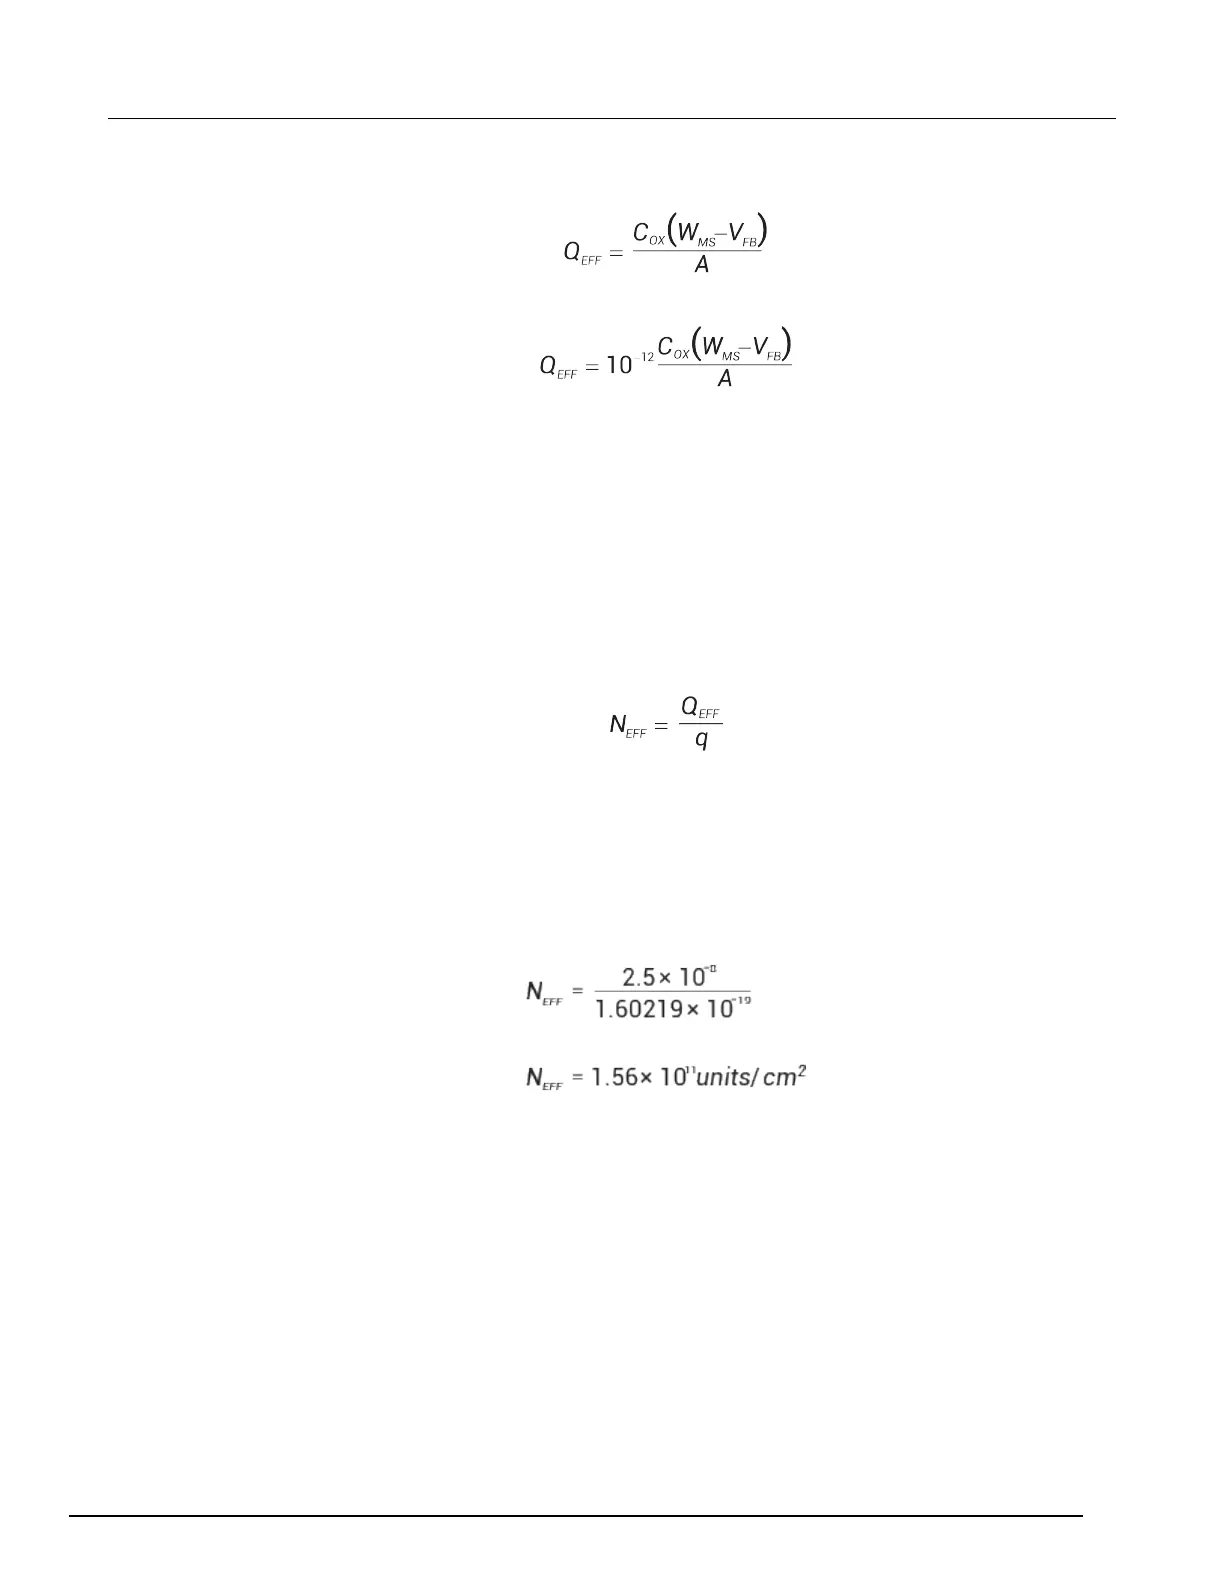
Note that C
OX
here is per unit of area. So that,
However, since C
OX
is in F, we must convert to pF by multiplying by 10
-12
as follows:
Where:
• Q
EFF
= effective charge (coul/cm
2
)
• C
OX
= oxide capacitance (pF)
• W
MS
= metal semiconductor work function (V)
• A = gate area (cm
2
)
For example, assume a 0.01cm
2
50 pF capacitor with a flatband voltage of -5.95 V, and a p-type
N
BULK
= 10
16
cm
-3
(resulting in W
MS
= -0.95 V). In this case, Q
EFF
= 2.5 x 10
-4
coul/cm
2
.
The effective oxide charge concentration, N
EFF
, is computed from effective oxide charge and electron
charge as follows:
Where:
• N
EFF
= effective concentration of oxide charge (Units of charge/cm
2
)
• Q
EFF
= effective oxide charge (coulombs/cm
2
)
• q = electron charge (1.60219 × 10
-19
coulombs)
For example, with an effective oxide charge of 2.5 x 10
-8
coul/cm
2
, the effective oxide charge
concentration is:
Doping profile
The doping profile of the device is derived from the C-V curve based on the definition of the
differential capacitance (measured by the 590 and 595) as the differential change in depletion region
charge produced by a differential change in gate voltage (Nicollian and Brews 380-389).
 Loading...