-SCS Parameter Analyzer Reference Manual Section 9: Keithley External Control Interface (KXCI)
4200A-901-01 Rev. C / February 2017 9-9
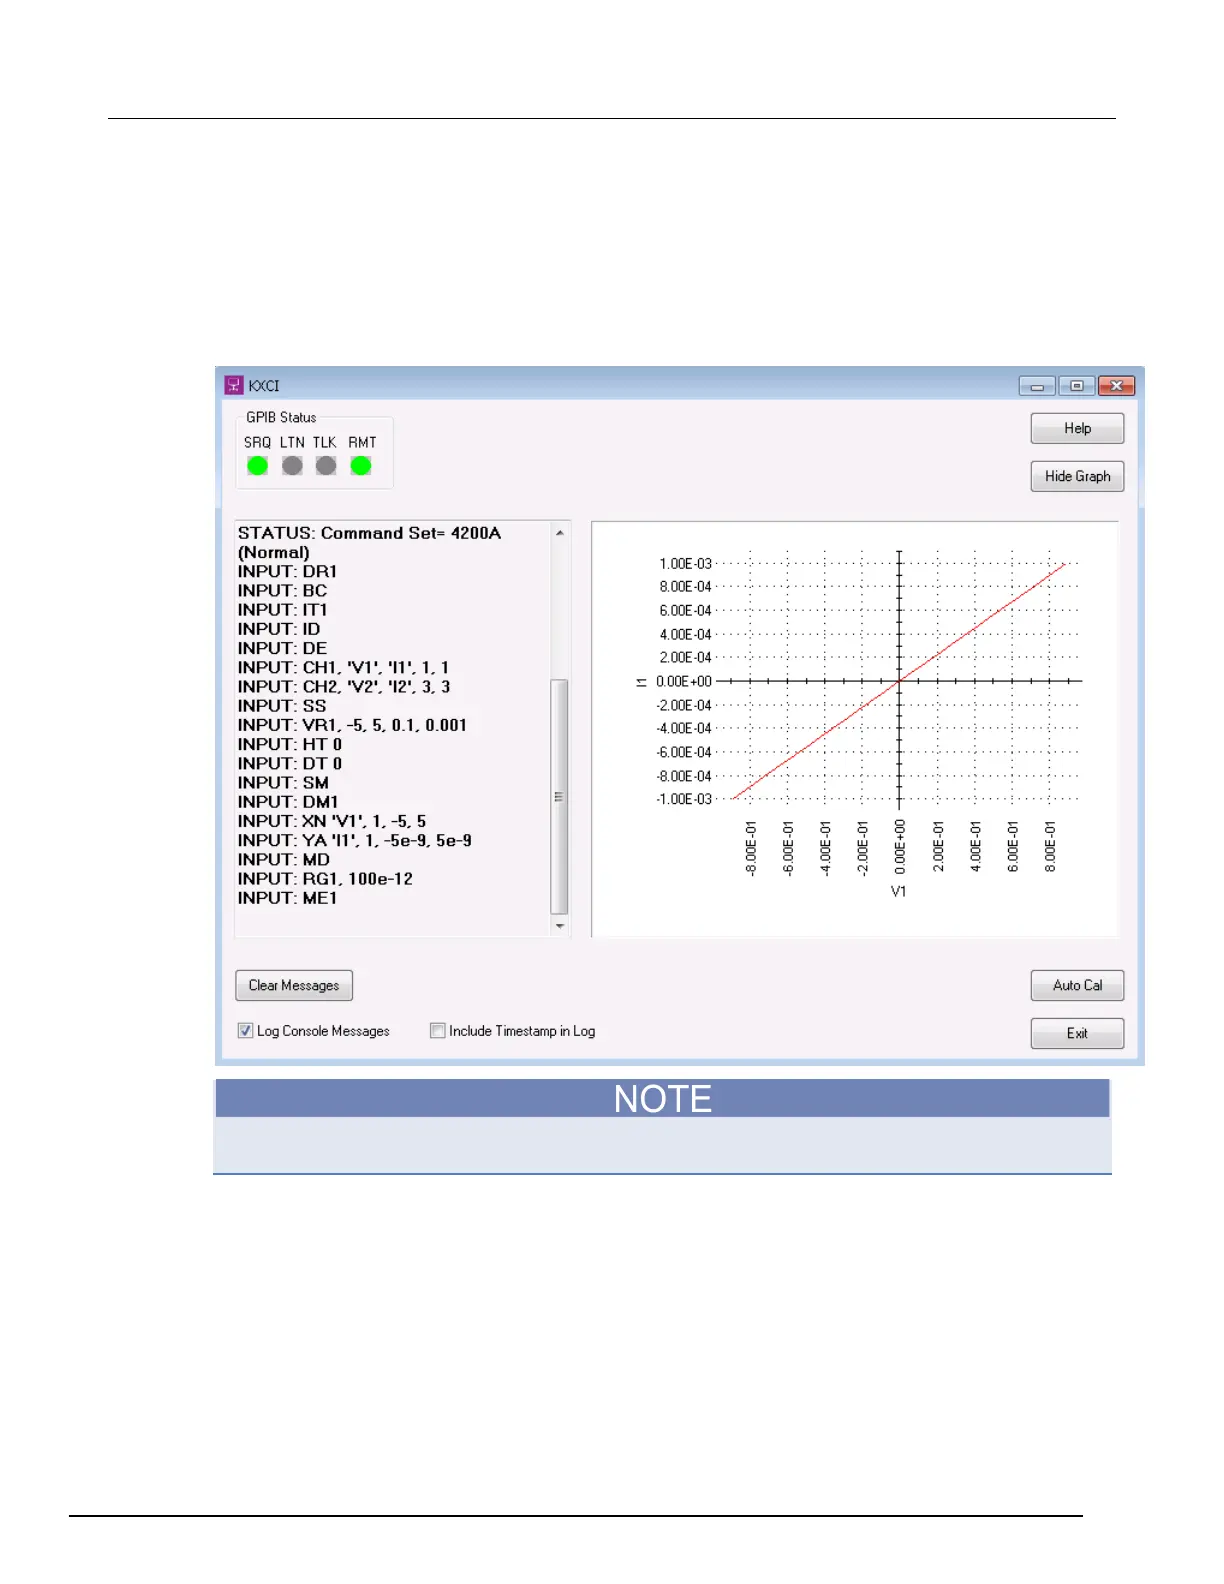
Graphing the test results
If you have sent the graphics commands (the DM1 command followed by the X-axis and Y-axis
configuration commands), KXCI displays a graph of the generated data. See the example graph and
graphics commands in the following figure.
Figure 464: KXCI data graph
KXCI plots all Y1 axis curves in red and all Y2 axis curves in blue. To hide the graph, select Hide
Graph.
 Loading...