-SCS Parameter Analyzer Reference Manual Section 5: Pulse measure and pulse generator units
4200A-901-01 Rev. C / February 2017 5-29
Scrolling the magnified area
To move the viewable area of the graph after you zoom in on a graph, hold down Shift while dragging
the mouse.
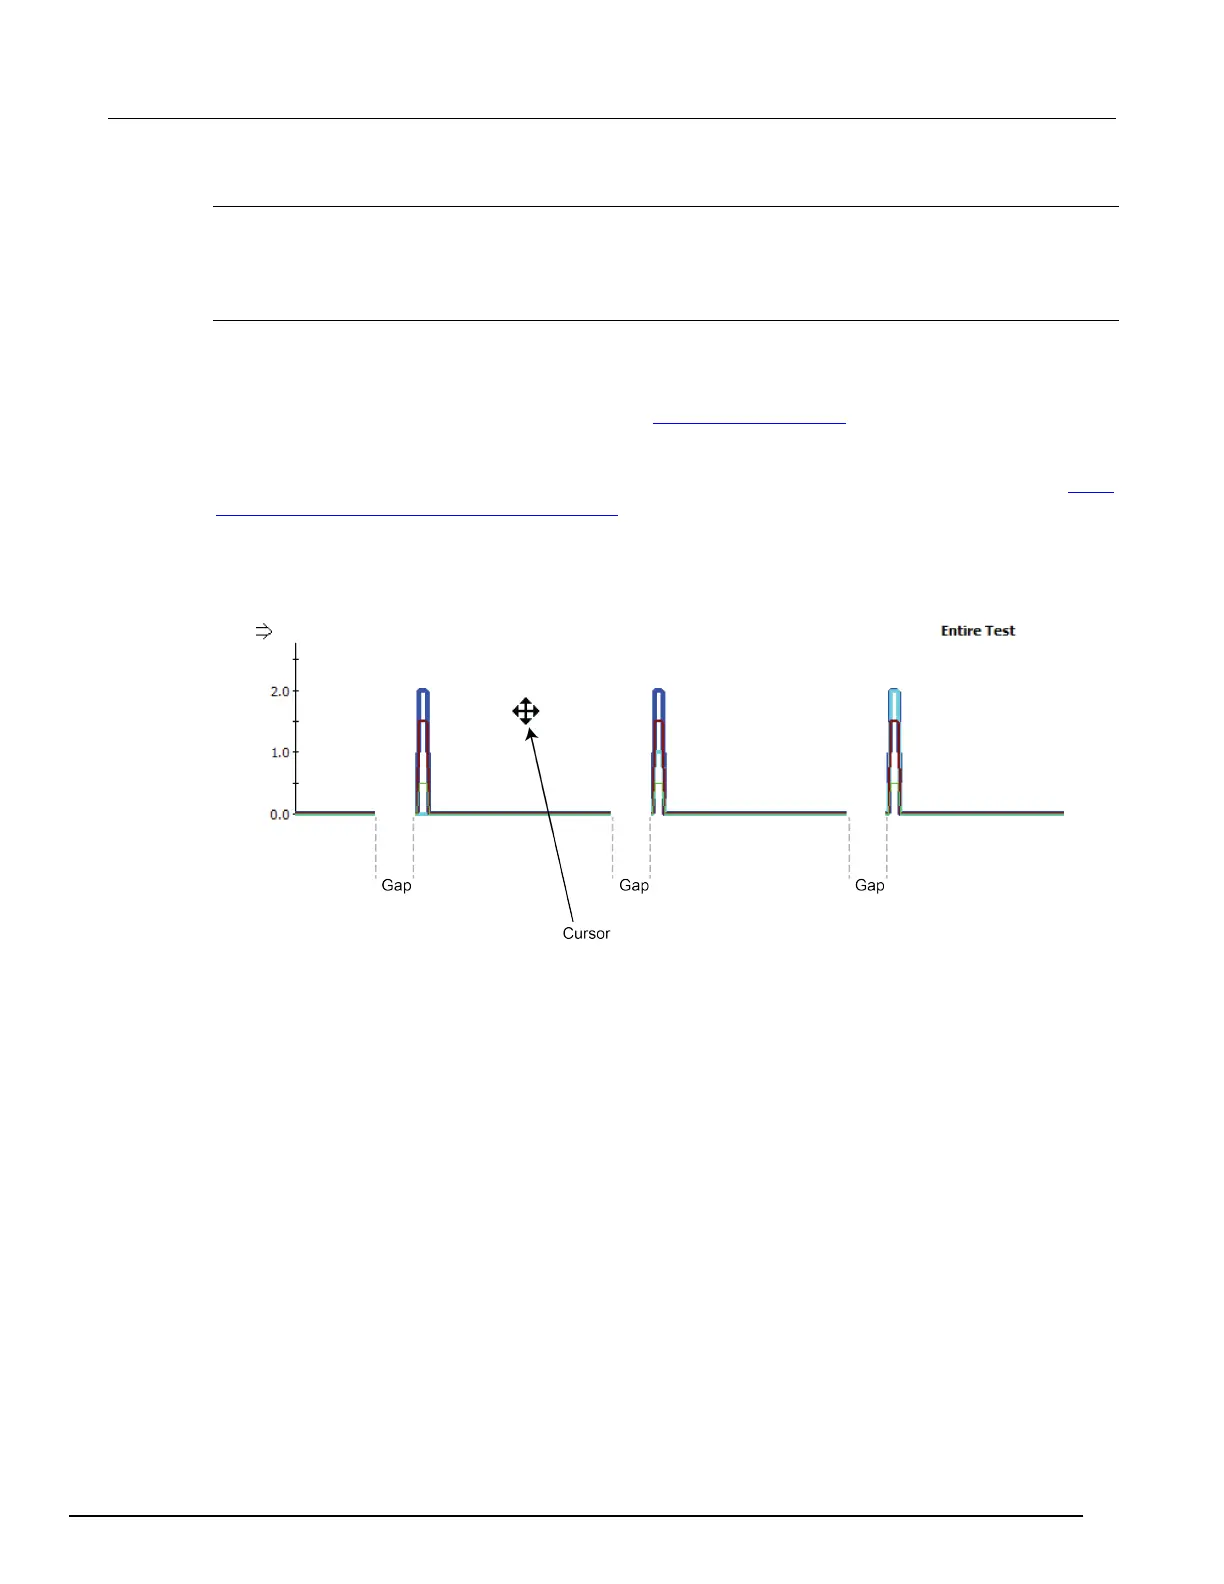
Entire Test zoom
The zoom feature is also supported on the lower Entire Test waveform graph in the same manner as
in the Expanded View. After you zoom in, you can also scroll (or move) the viewable area of the
graph. See the next figure for a view of moving the lower graph using the mouse pointer. Note the
gaps between the pulse waveforms shown in the Expanded View zoom (on page 5-27
) figure; gaps
also exist in the next figure. These gaps indicate the time between sweep points where the PMU
performs calculations for the test while the pulse channels output 0 V. To learn more about how these
gaps relate to how the PMU handles DUT load variation and measure ranging during a test, see
How
LLEC adjusts pulse output to the target levels (on page 5-35).
While holding down the Shift key on the 4200A-SCS keyboard and left mouse button, move or scroll a
magnified graph by moving the mouse.
Figure 168: Scroll (or move) a magnified entire test graph
 Loading...