6: Clarius Model 4200A-SCS Parameter Analyzer
6-198 4200A-901-01 Rev. C / February 2017
To define a graph:
1. Select Graph Settings.
2. Select Define Graph. An example of the Graph Definition dialog box is shown in the following
figure.
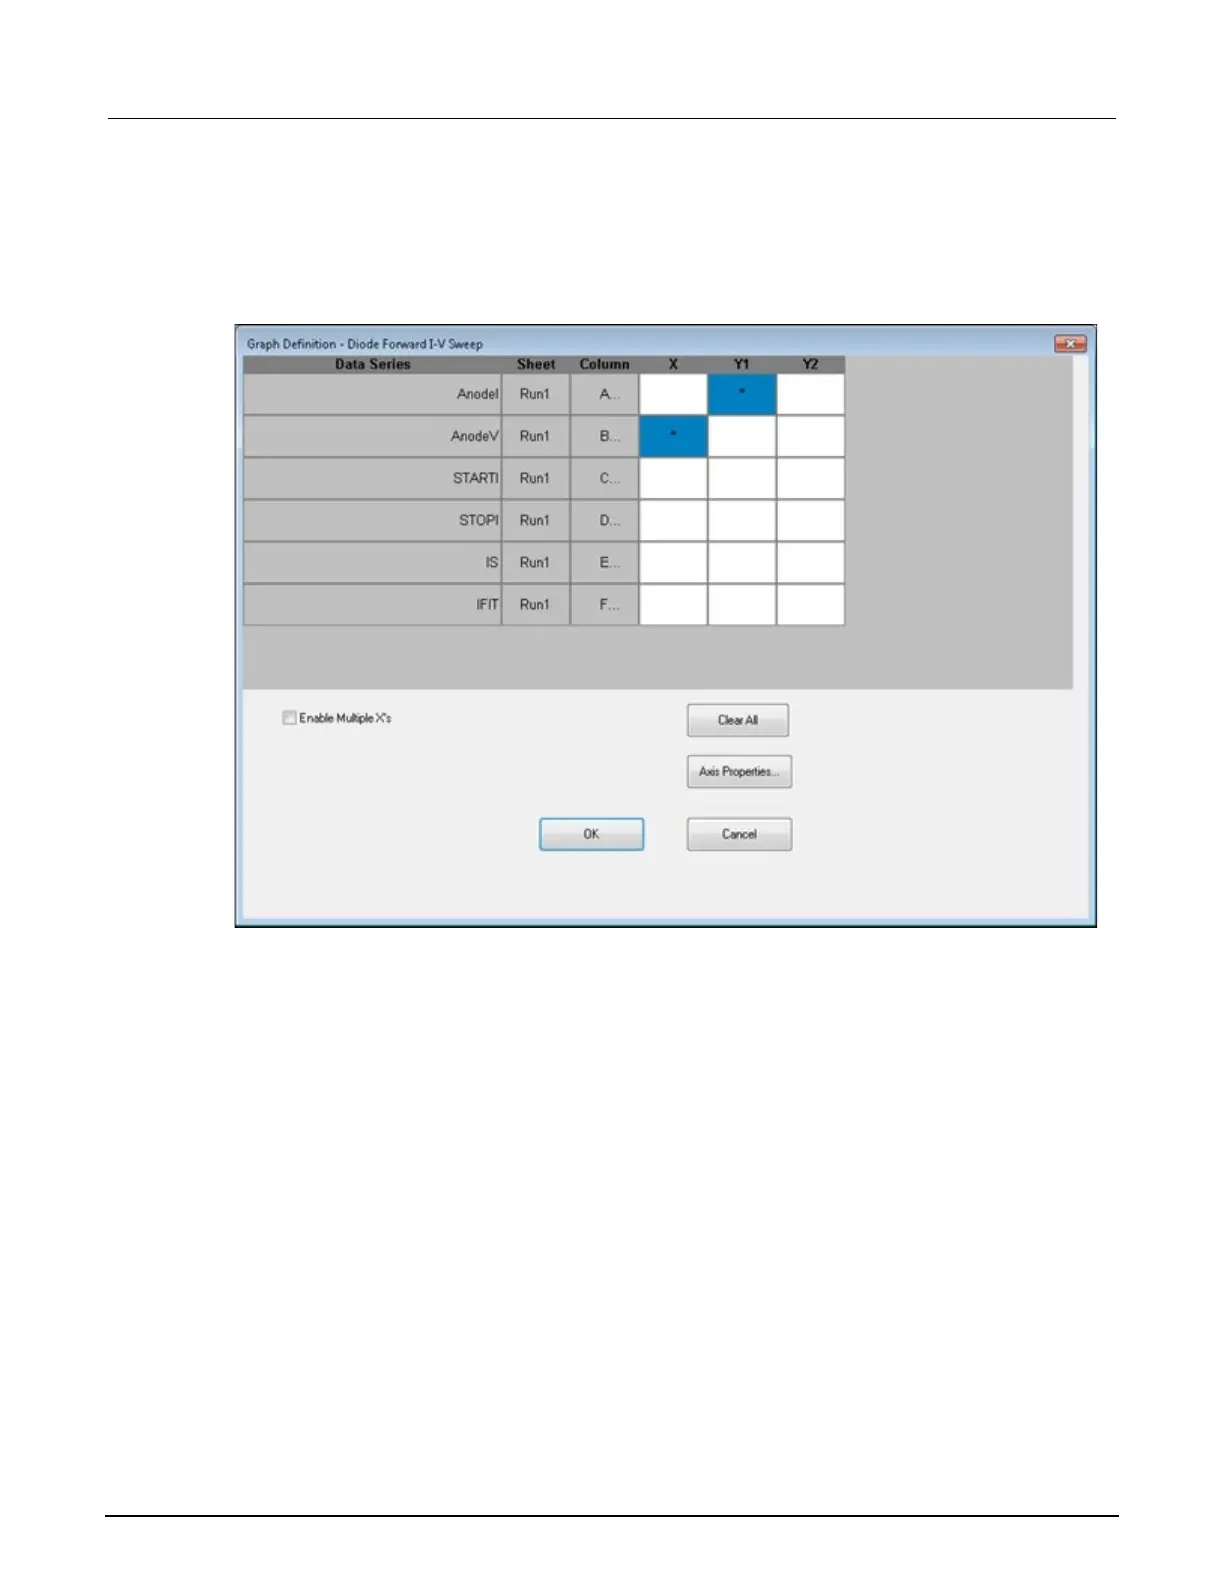
Figure 358: Graph Definition tab for vfd test
3. For each data series, select the axis on which to plot the parameter. The axes are:
X: X axis.
Y1: Y axis on the left side of the graph.
Y2: Y axis on the right side of the graph. The Y2 axis can have a different scale and label
than the Y1 axis.
 Loading...