-SCS Parameter Analyzer Reference Manual Section 6:
4200A-901-01 Rev. C / February 2017 6-199
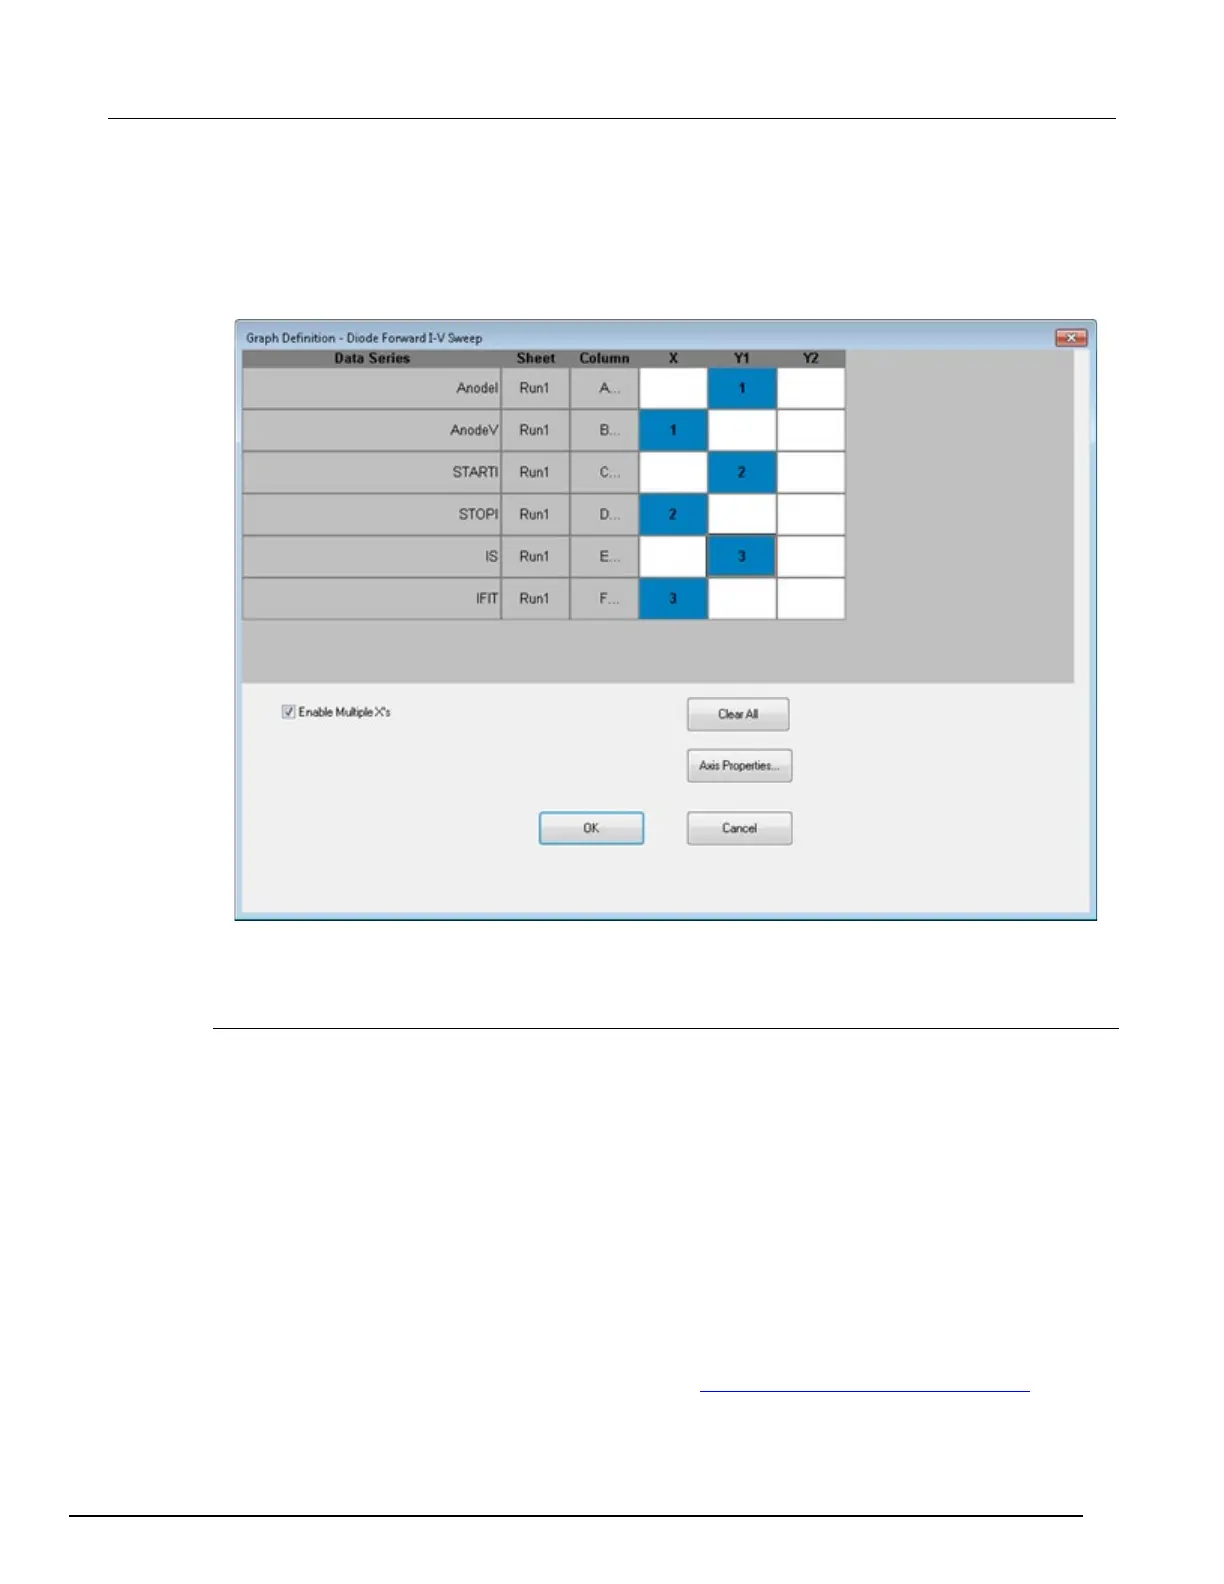
4. If the test does not define a family of curves, you can select Enable Multiple X’s, as shown in the
following figure. If you select multiple X’s:
Select a Y for each X. The number in the cell indicates the relationships.
To change the number, click the cell until the correct number is displayed.
Figure 359: Graph Definition dialog box with multiple X's selected
5. Click OK.
6. To clear the settings, select Clear All.
View plot coordinates and data series properties
When you select a data point on any graph using the mouse or other pointing device, Clarius displays
the following information about the point:
• Data series.
• Row worksheet row number.
• Coordinates to four decimal places.
This feature allows you to check information about any point on the graph.
To display the information:
1. Place the default graph cursor over the plot line at approximately the location of the data point.
2. Move the cursor along the plot line until it is over the data point. The cursor changes to the
pointer cursor and the coordinates display above it.
3. To display additional information about the data series used for this point, right-click. The Data
Series Properties dialog box is displayed. Refer to Change the display of the series data
(on page
6-218) for information.
 Loading...