6: Clarius Model 4200A-SCS Parameter Analyzer
6-218 4200A-901-01 Rev. C / February 2017
Change the graph colors
You can change the colors of graph foreground (the plot area) and background (outside the plot area)
and determine if the time and date are displayed.
You can also select Monochrome, which changes all options on the graph, including plot lines, titles,
and axes, to black and white. You cannot revert to your previous settings after selecting
Monochrome.
To change the colors:
1. On the graph, right-click and select Graph Properties > Graph Area. The Graph Area dialog box
is displayed.
2. To change the color of the plot area, select a color from the Foreground list.
3. To change the color of the background, select a color from the Background list.
4. To remove the time and date display from the graph, select Remove Time/Date.
5. Click OK.
Change the display of the series data
You can define the line pattern, shape, color, and width for each series of data on the graph.
To define the data properties:
1. Select Analyze.
2. Select Graph Settings.
3. Select Graph Properties.
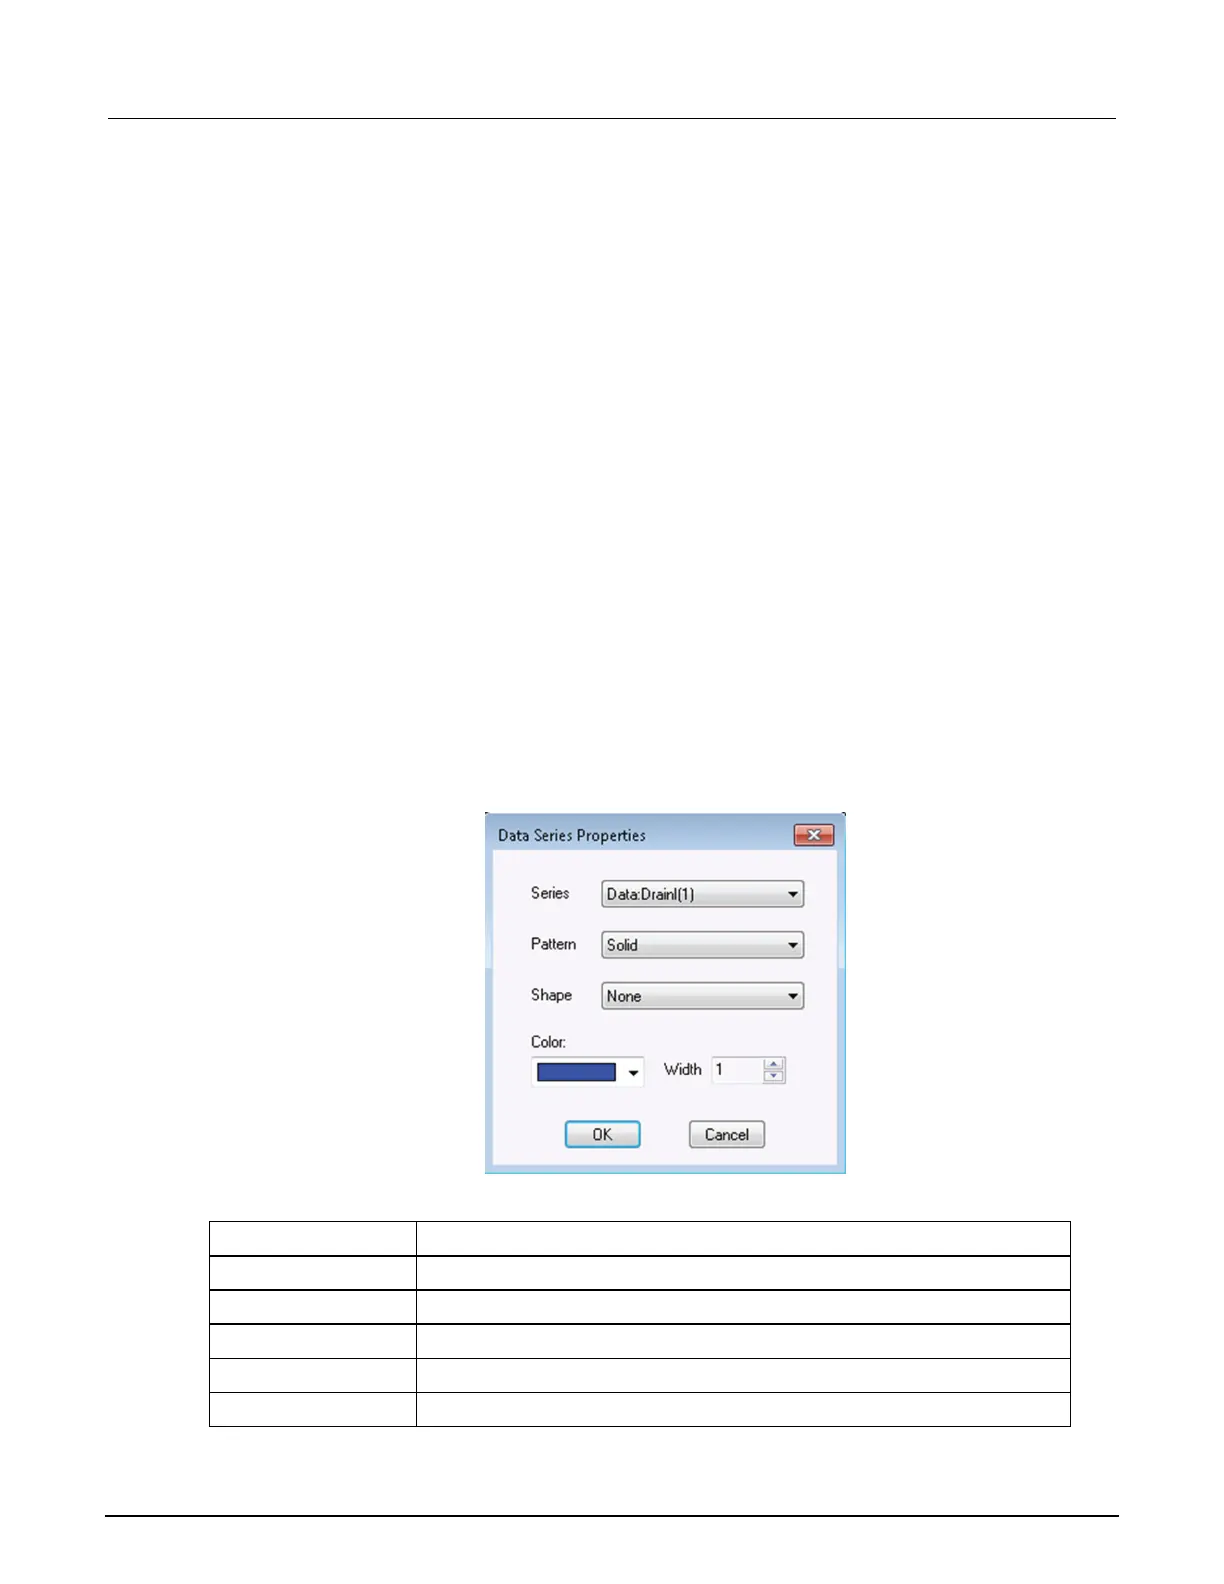
4. Select Series. The dialog box shown below opens.
Figure 374: Data Series Properties dialog box
The options for the series are described in the following table.
Option Description
Series
Select the series of data to which the settings apply.
Pattern
Select the line pattern for the plot line.
Shape
Select the shape that is used for the data points.
Color
Select a color for the plot line.
Width
Select the width of the plot line.
 Loading...