EasyManuals Logo

Keithley 4200A-SCS Reference Manual

Keithley 4200A-SCS
1381 pages
To Next Page IconTo Next Page
To Previous Page IconTo Previous Page
Page #490 background imageLoading...
Page #490 background image
Model 4200A
-SCS Parameter Analyzer Reference Manual Section 6:
Clarius
4200A-901-01 Rev. C / February 2017 6-221
Cycle mode graphs
The graphs for the Cycle Mode plot output values versus the cycle index. Each data point in the
graph represents an output value reading for each subsite cycle. The following figure explains how to
display the various graphs.
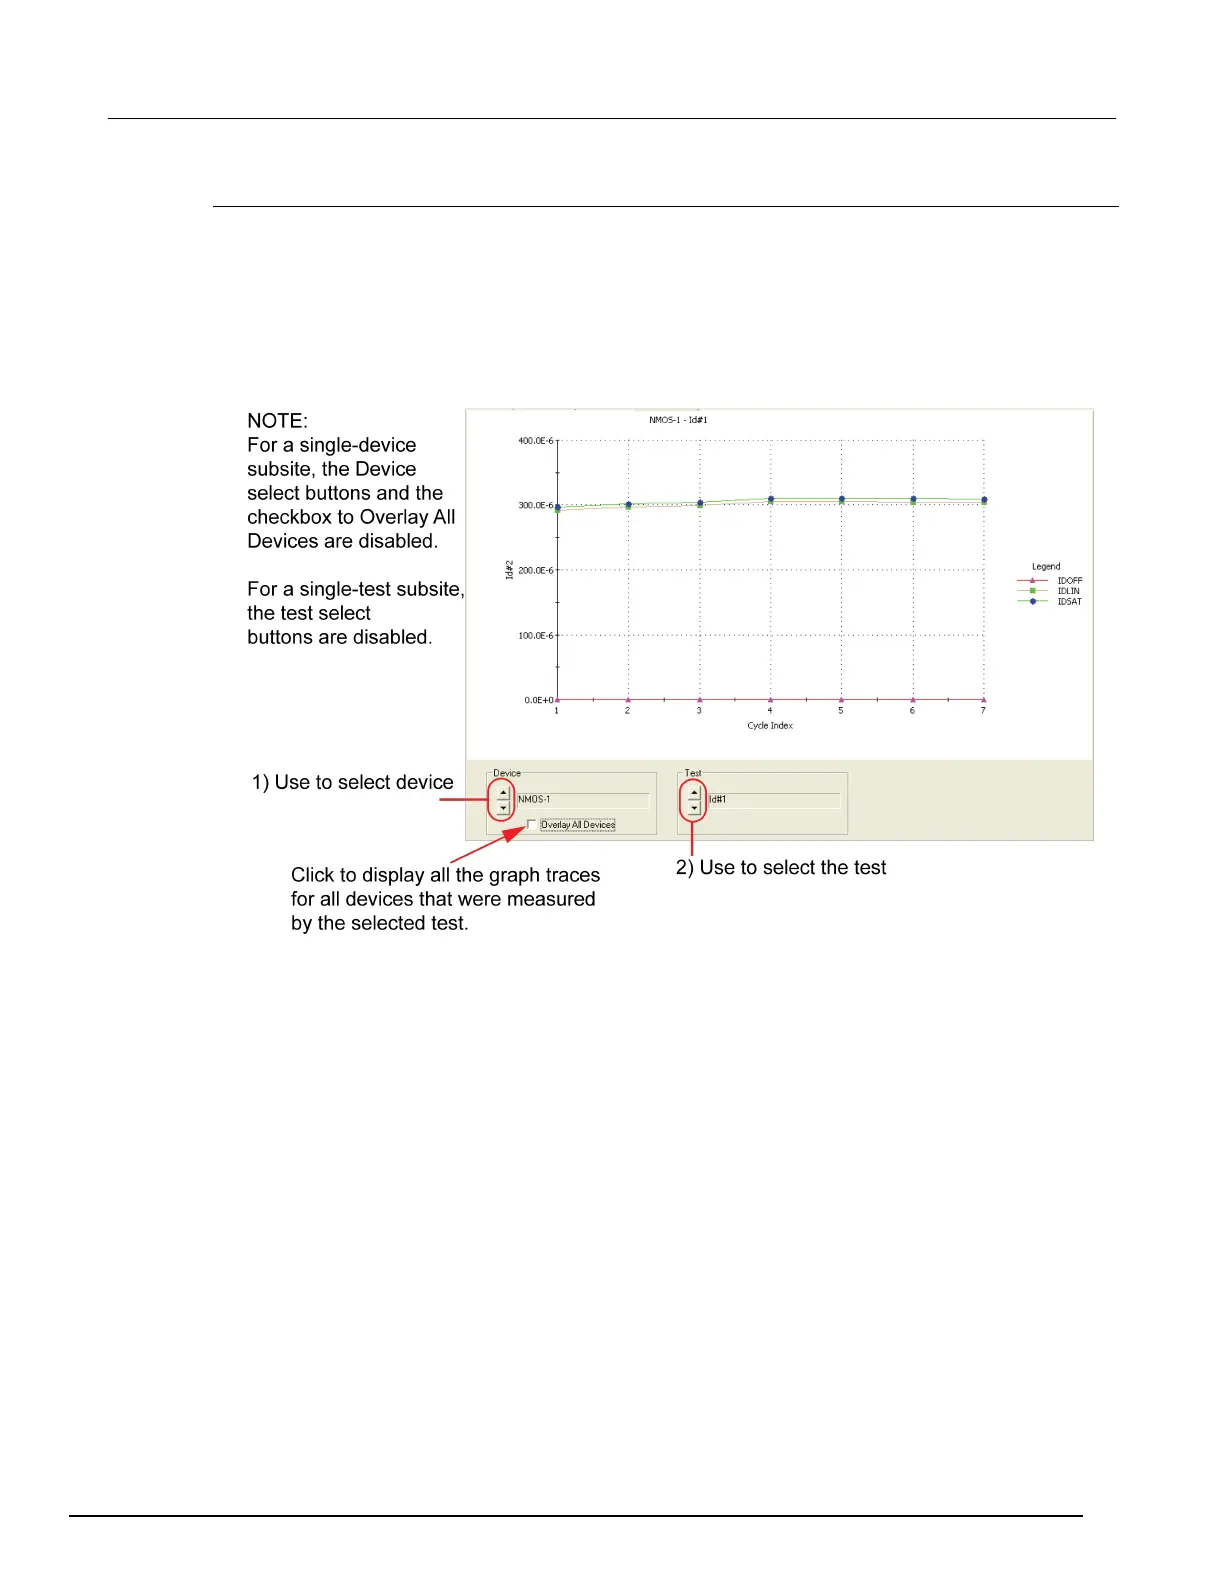
This figure shows the graph traces for test ID#1 for the NMOS-1 device. The three traces are for the
output values IDOFF, IDLIN and IDSAT.
Figure 376: Subsite Analyze graph: Cycle mode

Table of Contents

Other manuals for Keithley 4200A-SCS

Questions and Answers:

Question and Answer IconNeed help?

Do you have a question about the Keithley 4200A-SCS and is the answer not in the manual?

Keithley 4200A-SCS Specifications

General IconGeneral
BrandKeithley
Model4200A-SCS
CategoryMeasuring Instruments
LanguageEnglish

Related product manuals