-SCS Parameter Analyzer Reference Manual Section 6:
4200A-901-01 Rev. C / February 2017 6-271
Viewing analysis results in the Analyze sheet
After executing a new formula, a new column of data containing the results is added to the Analyze
worksheet. If the formula in the upper Formula box was edited to replace a previous version, the
corresponding worksheet column updates to reflect the changes. In some cases, a results column
contains only a single value.
After some Formulator calculations, you may see one or more instances of the #REF notation in a
column, instead of a number. #REF in a cell indicates that a valid value could not be calculated. This
occurs when a Formulator function needs multiple rows as arguments, when a calculated value is
out of range, when a divide by zero is attempted, and so on.
For example, each result of the DIFF function is a difference coefficient that is calculated as the ratio
DValues1/DValues2, where DValues1 and DValues2 are differences between values in the
present row and values in the previous row. Because no previous row exists before the first row, a
valid calculation is not possible for the first row.
Therefore, the Formulator returns the #REF notation in the first row.
A column contains multiple instances of #REF if the Formulator function requires multiple prior cells
for the calculation. For example, if the MAVG function is using five data points to calculate a moving
average of a column containing five values, the first two and last two cells contain #REF.
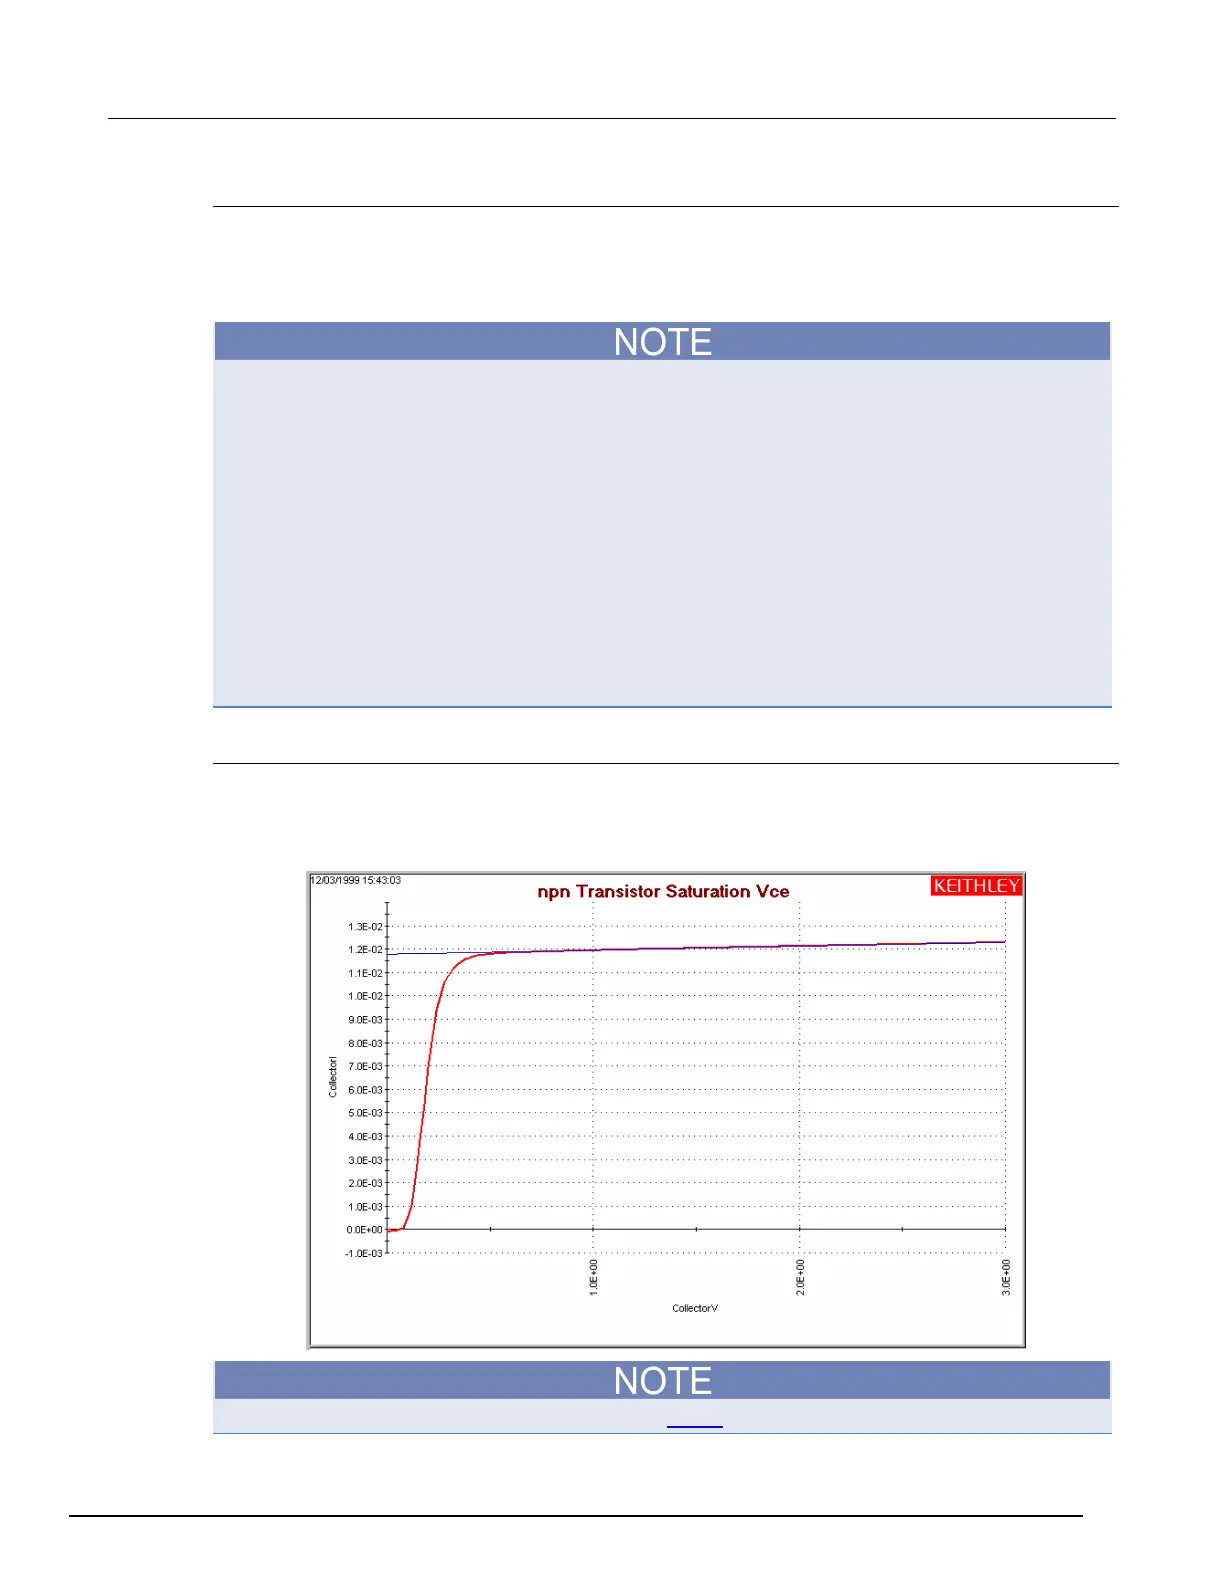
Viewing analysis results in the Analyze graph
If a new column (vector) is added to the Analyze sheet after you create or change a formula, it can be
plotted in the Analyze graph like any other column (vector). See the following figure.
Figure 385: Added linear regression line to the graph
For information about using the Graph tab, refer to Graph (on page 6-196).
 Loading...