-SCS Parameter Analyzer Reference Manual Section 6:
4200A-901-01 Rev. C / February 2017 6-189
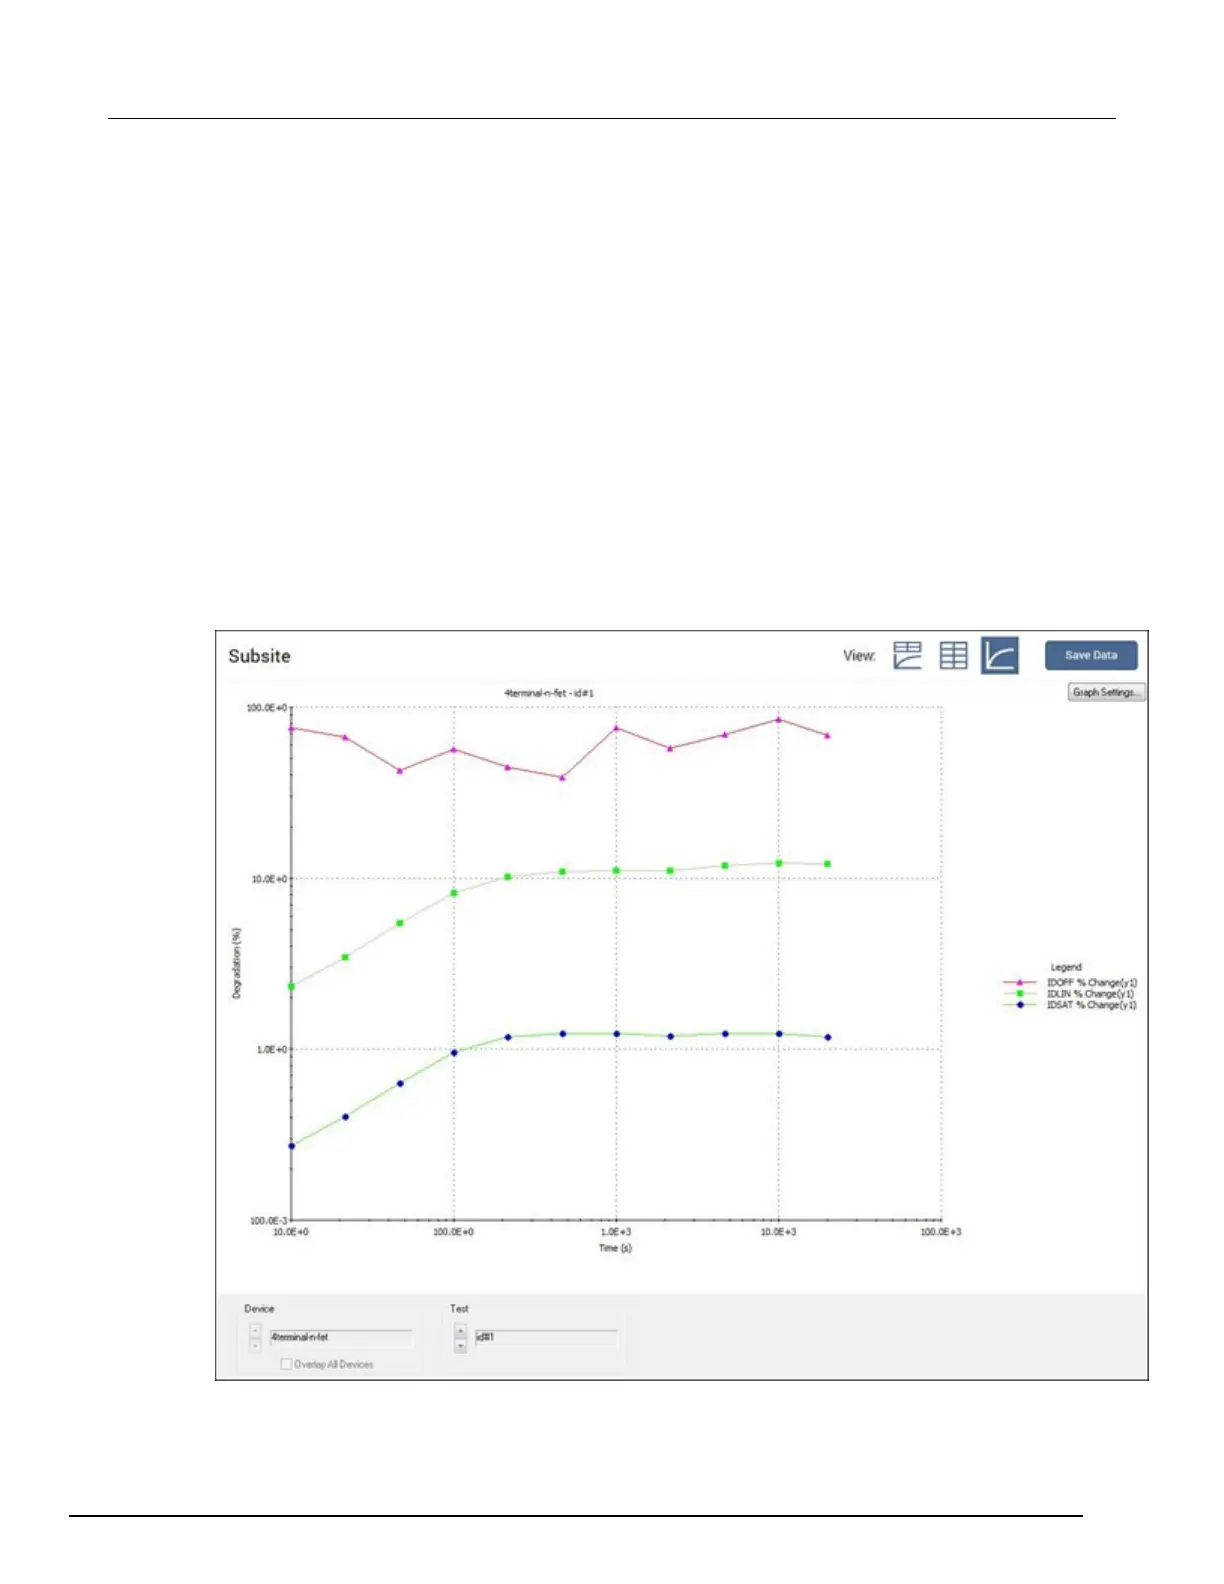
Stress/measure mode Analyze graph
The graphs for the stress/measure mode plot degradation (in %) versus the stress times. Each data
point in the graph represents the device degradation (% Change) for tests after each stress cycle
(stress time).
The graph below traces for test id#1 for the 4terminal-n-fet device. The three traces are for
Output Values I
DOFF
, I
DLIN
, and I
DSAT
.
The options at the bottom of the graph allow you to change which device and test data is graphed.
The options are:
• Device: Select the device for which to display data. For a single-device subsite, this option is not
available.
• Overlay All Devices: Select this option to display all the graph traces for all devices that were
measured by the selected test. For a single-device subsite, this option is not available.
• Test: Select the test for which to display data.
The output values for each test can be graphed as shown in the following figure.
Figure 350: Stress/measure mode graph
 Loading...