To print this test plot go to Menu List>2. Image Quality Plots>2.3 Substrate Advance>2.3.2 Print Adjustment
Plot.
This plot enables you to visually determine the accuracy of the substrate advance, if there are any
advancement issues they will appear in this diagnostic plot.
The plot can be used to precisely measure the substrate advance error with a one-dot row accuracy to verify
the stability of the substrate advance.
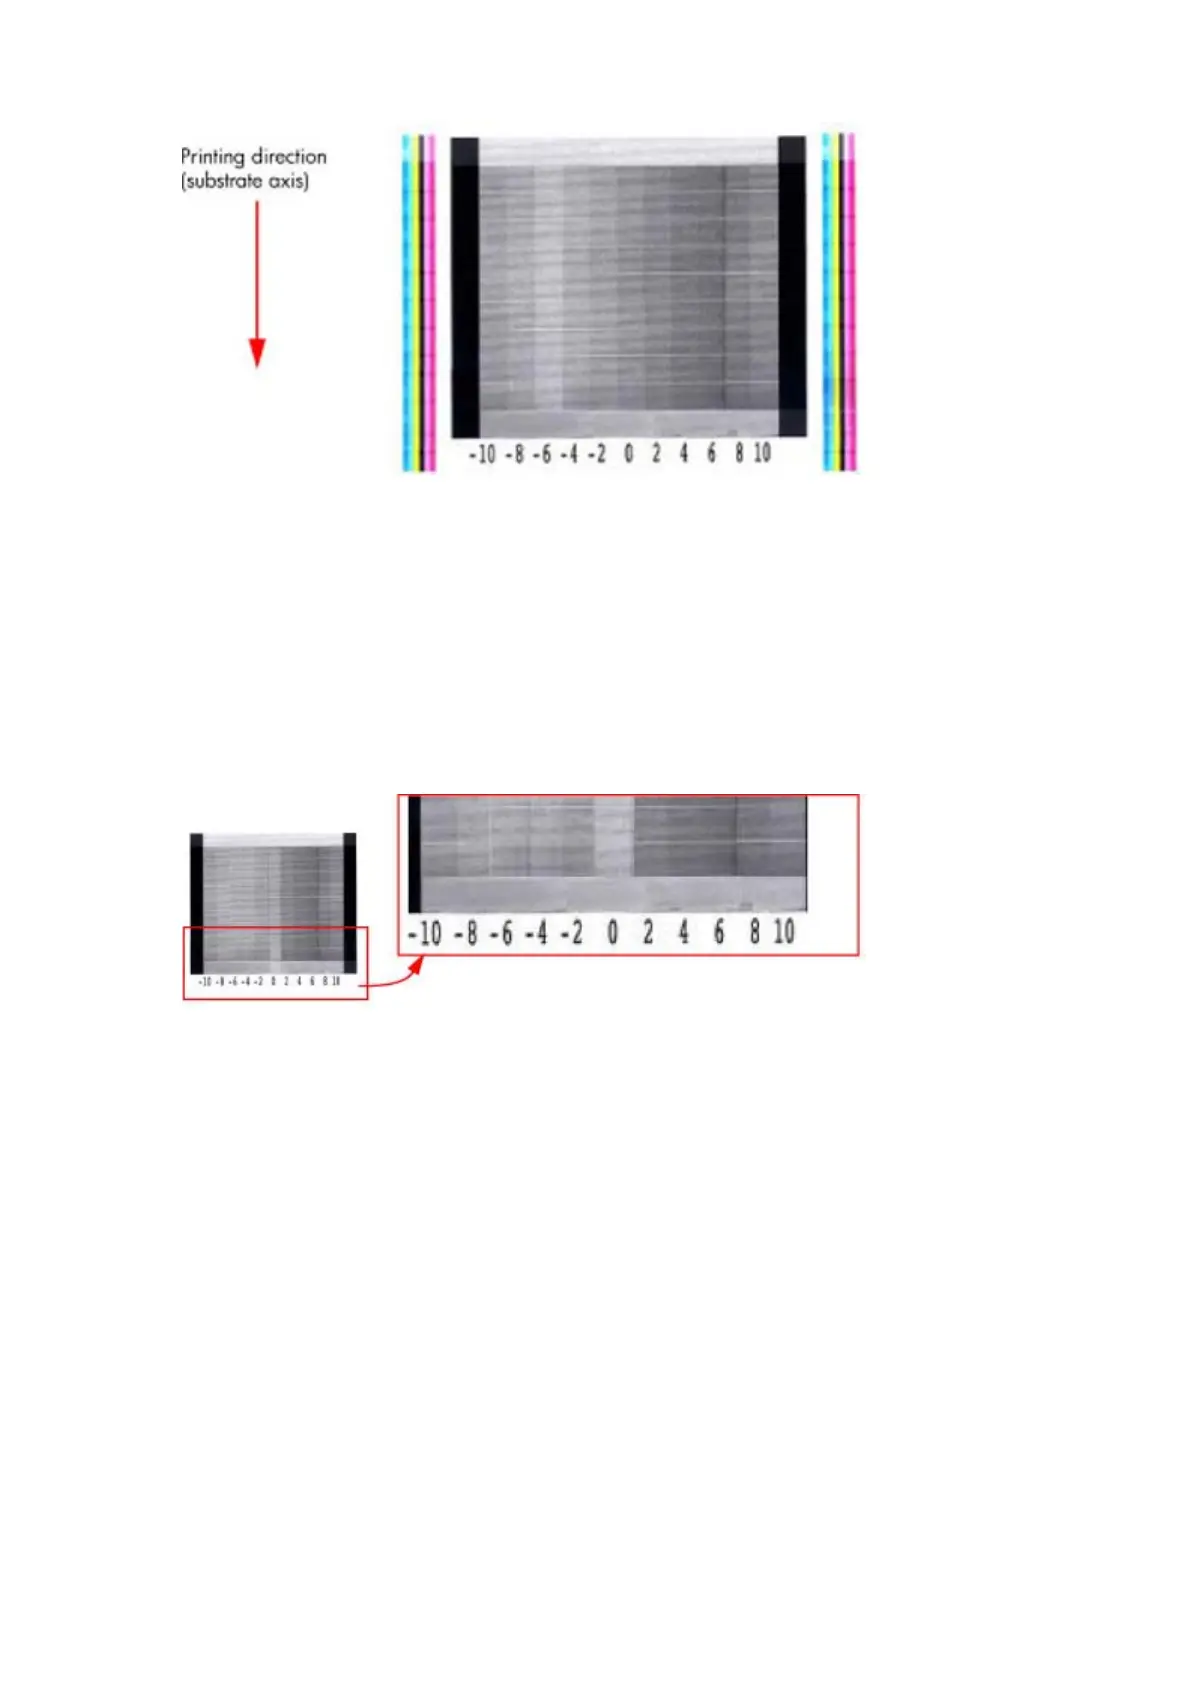
The sample is composed of 11 vertical columns named -10 to 10. Each single column represents an advance
deviation, so column -10 corresponds to a minus deviation and 10 corresponds to a plus deviation. The
advance obtained along the scan axis direction corresponds with the position of the lighter portion of the
pattern in each advance, as shown on the next page.
A perfectly calibrated printer will show a straight vertical ligther line in the 0 column, and values of +2 to -2
will also provide good advance results for most print modes. If the lighter line is printed in any of the other
columns, this would indicated there is a constant advance offset along the entire plot. If the offset is bigger
than ± 2.95 mm per meter (the lighter column is not the center one), this can be adjusted by using the button
on the front panel to change the compensation of the substrate advance as the printer prints.
It is very important to verify that the substrate selected on the front panel, is the same as the actual
substrate loaded on the printer. You can verify the substrate type selected through the front panel (Main
Menu>Substrate Menu>View Loaded substrate). If an incorrect substrate is selected, this will produce an
offset error in the Substrate Advance.
Corrective action
The figure shown here (left) shows a vertical lighter shaded line placed at column -6, which indicates an
offset of 8.57mm per meter.
192 Chapter 5 Print quality ENWW
 Loading...


