228 Rockwell Automation Publication 2198-UM004D-EN-P - December 2022
Chapter 9 Tuning
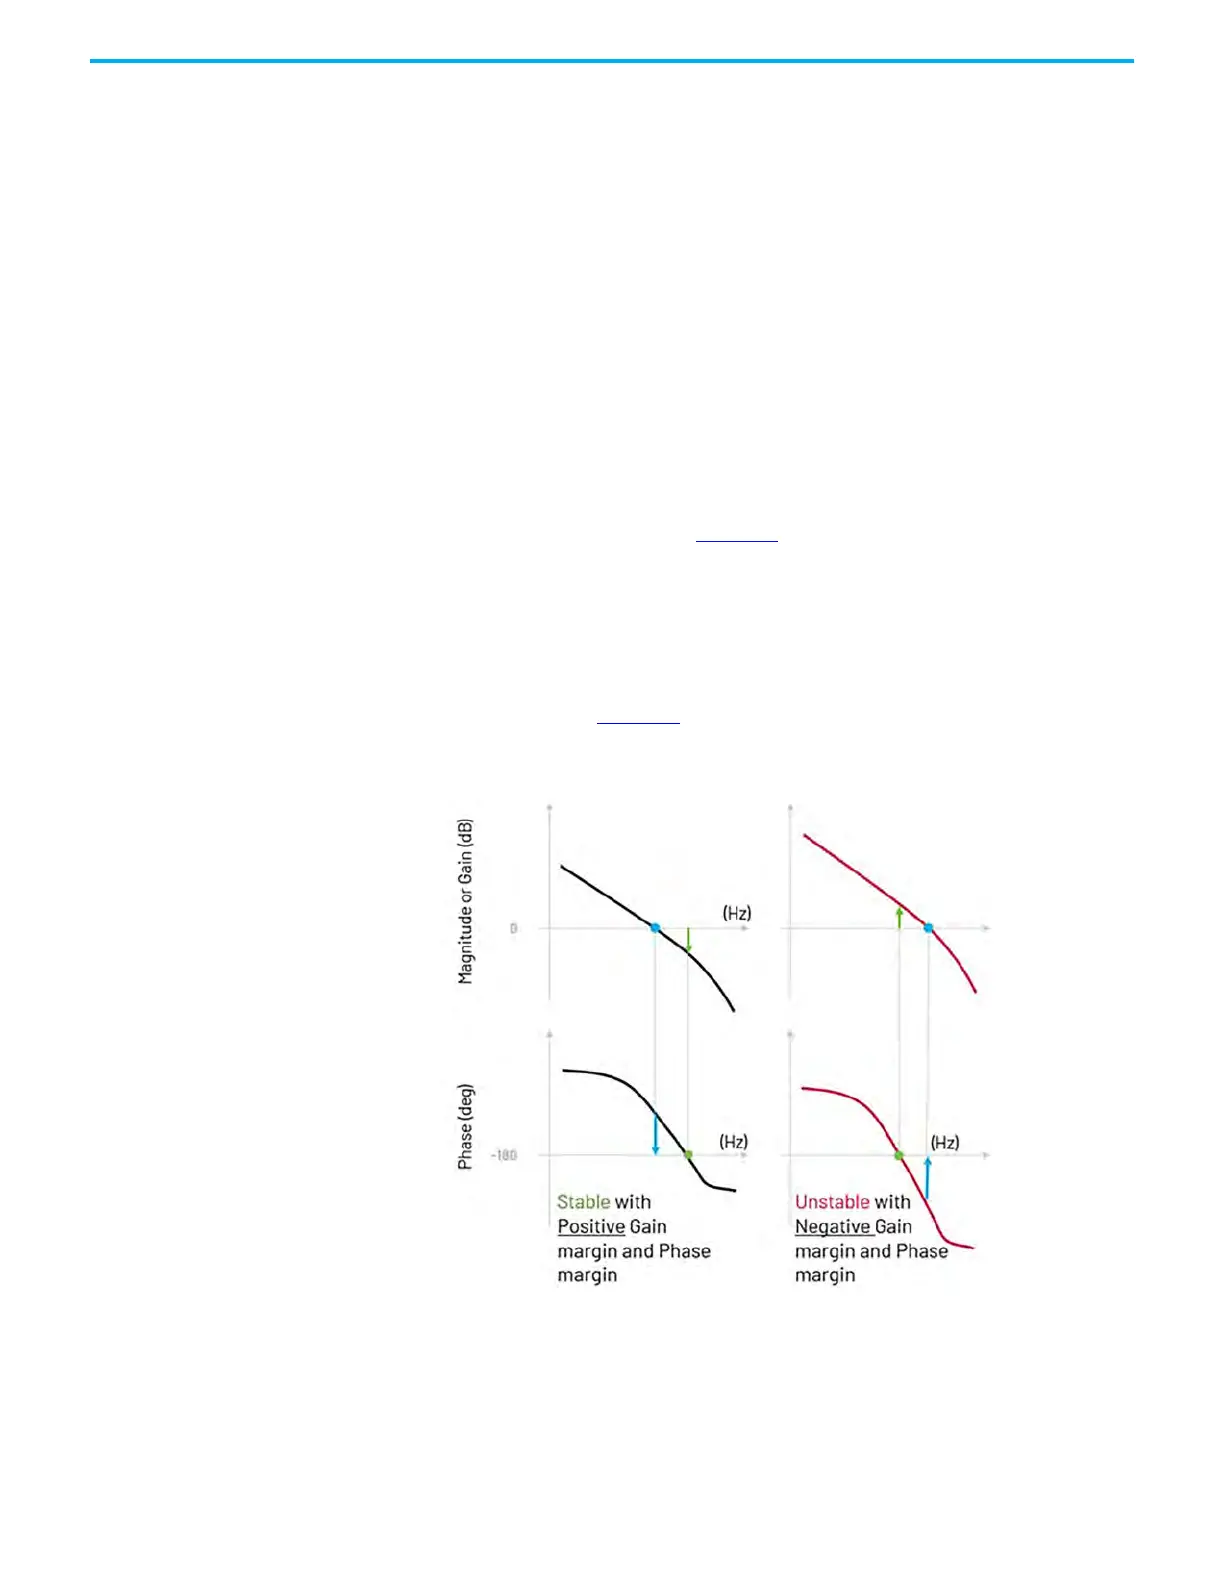
System Analysis The Kinetix 5100 drive can create a bode plot by using the System Analysis test.
The bode plot lets you see the frequency response of a system. By applying an
input signal and comparing it to an output signal, we can see a variation in the
magnitude and shift in phase of that signal. The Bode plot shows these
variations as part of the System Analysis test in the KNX5100C software.
Phase Margin and Gain Margin
The phase margin is the amount of open-loop change required to make a
closed loop system unstable. In other words, the available Phase (degree)
before the system becomes unstable. The phase margin is measured at the 0 dB
Magnitude point of the bode plot. When the Phase (degree) reaches -180, the
signal flips, which causes instability. The Phase Margin is the available phase
from the System's phase measurement to the -180-degree point. If the Phase
margin is close to zero (or negative), the system is susceptible to ringing and
overshoot, which is shown in Figure 95
.
The gain margin is a measure of gain amplification used to reduce error
between the input and output signals. Gain Margin is the available gain before
the system becomes unstable. When the Phase (deg) reaches -180 degrees, the
signal will flip causing instability. The Gain Margin is measured at this point of
the bode plot and is shown as the available gain until the 0 dB point is reached,
which is shown in Figure 95
.
Figure 95 - Phase and Gain Margin

 Loading...