Rockwell Automation Publication 2198-UM004D-EN-P - December 2022 231
Chapter 9 Tuning
System Analysis Results
Now that the bode plot is understood, we can show some examples from the
test.
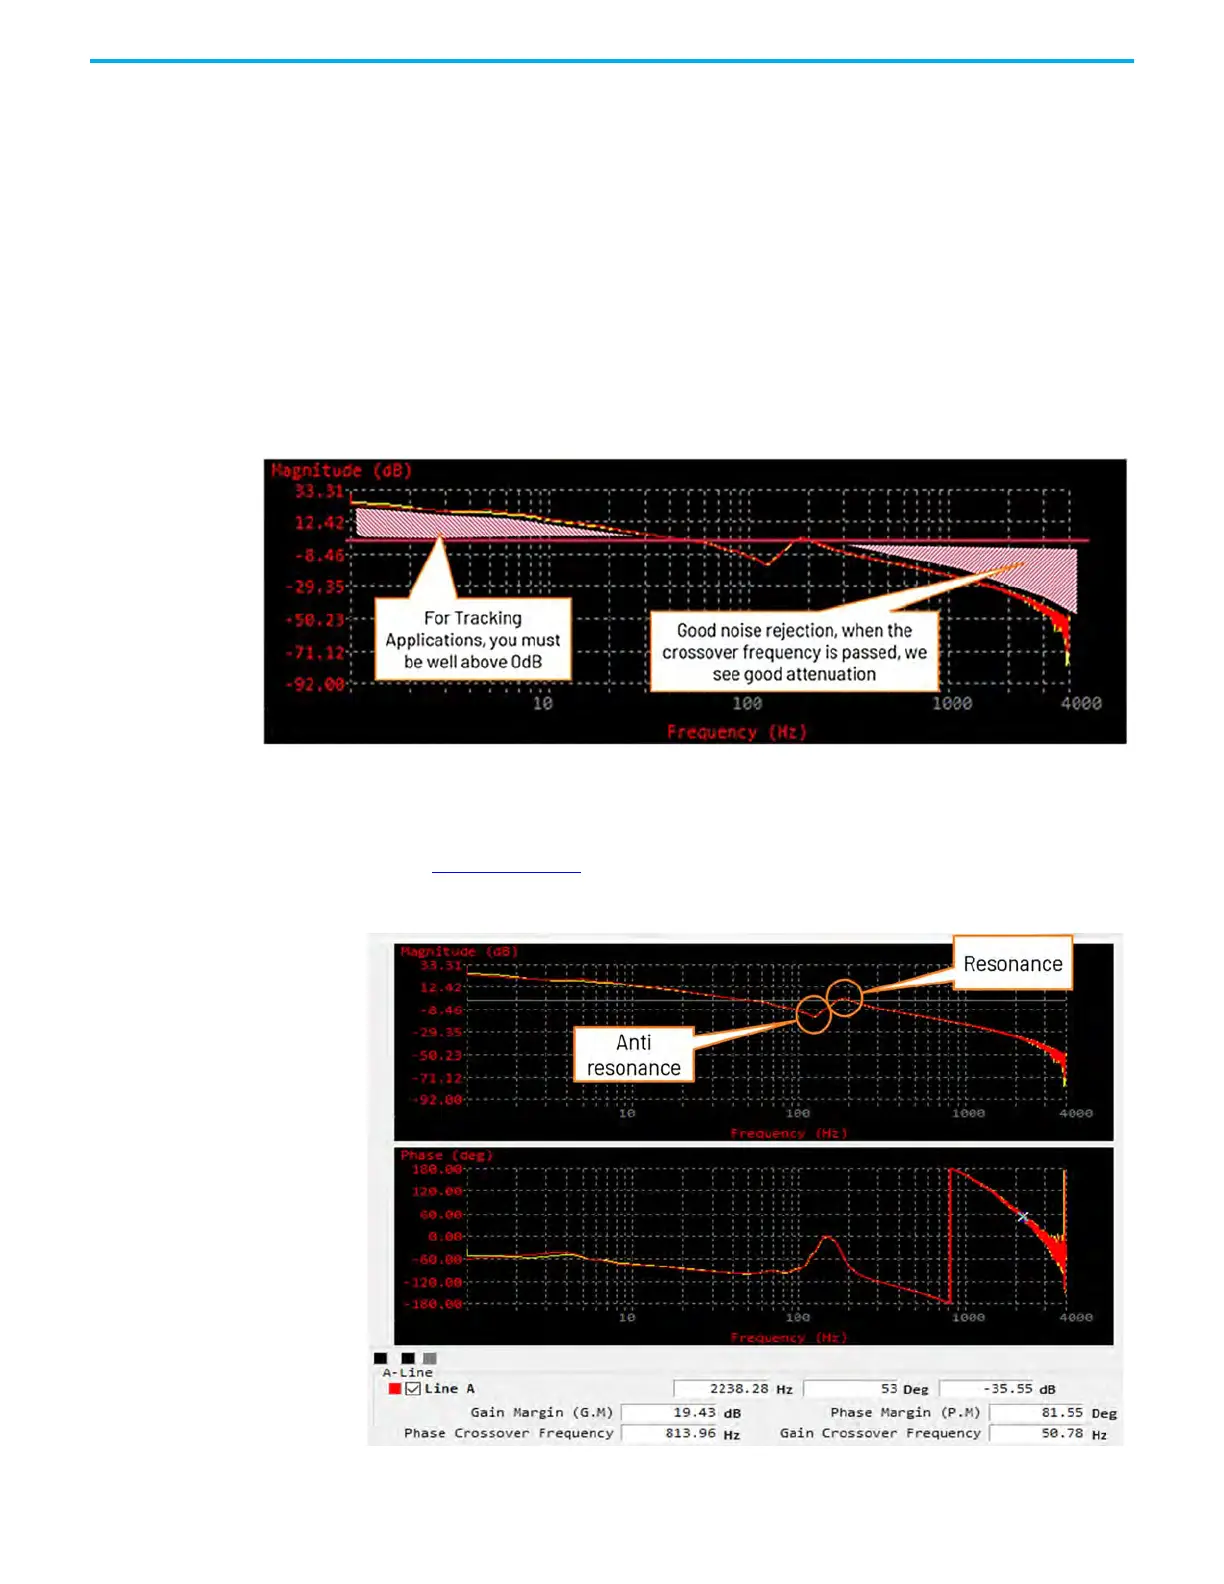
The larger the magnitude of gain above 0 dB, the better the ability to track
(command vs. actual). Generally, a larger magnitude means the command is
being tightly followed by the motor and a higher performing system. If gains
are changed, you can execute the System Analysis to see the new results from
the bode plot, which tells you if the system response has improved.
Once we pass the crossover frequency, we want a high level of attenuation on
the signal, which indicates good noise rejection.
The bode plot is a good way to see resonance that occurs either naturally or
because of a problem in your system. It is common to use an FFT (Fast Fourier
Transform) tool that can help diagnose the frequency of the resonance (see
MOTION-AT005
). If such a tool is not available, you can also see resonance
(and anti-resonance) frequencies from the bode plot.

 Loading...