230 Rockwell Automation Publication 2198-UM004D-EN-P - December 2022
Chapter 9 Tuning
System Analysis Tool
The System Analysis can be accessed from KNX5100C software Function
List>Settings>System Analysis. This Analysis will attempt to estimate the
Phase Margin and Gain Margin for your load.
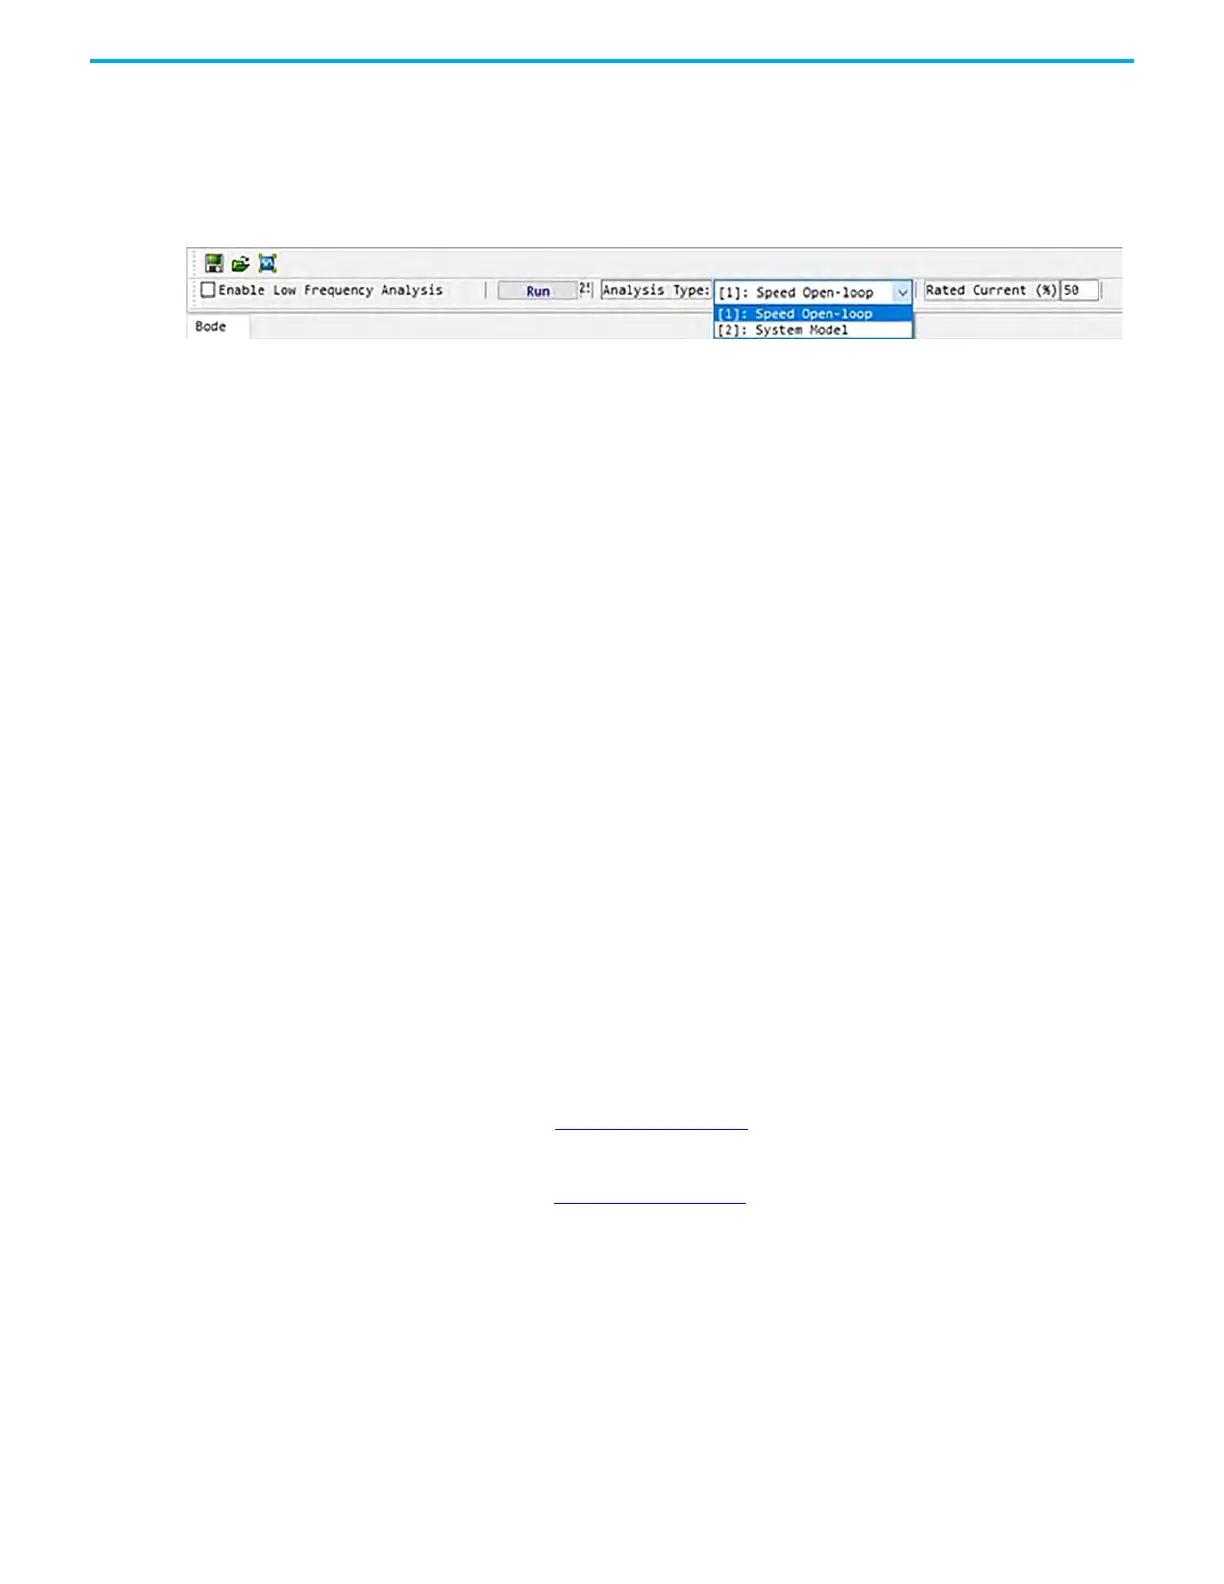
Analysis Type:
• Speed Open-Loop - Speed control is performed open-loop. The bode plot
analysis is based on Kvp (speed loop proportional gain) and Kvi (speed
loop integral gain). This is the method that is generally used for good
results.
• System Module - System module attempts to analyze your mechanism.
This analysis type will not provide gain or phase margin; instead, it
attempts to provide a mechanical representation of the system and will
not be impacted by your existing gains. This method should not be used
on a compliant mechanism as variation of these mechanisms cannot
typically be transferred to the bode plot. When you need to analyze the
allowable command response or resonance, or if abnormal vibration
occurs that cannot be removed, the System Module can be used to
analyze the mechanism.
• Rated Current (%) - This is the current level to use for the test. This can
be set up to 300%. The larger the load inertia of the mechanism, the
higher this setting should be. However, the setting is typically below
100%. The test results may be incorrectly reported using values that are
too large (or too small).
• Enable Low Frequency Analysis - This is typically used when you want the
analysis to be focused on low frequency response, ie: within the servo
loop bandwidth. This is typically not used.
Execute the System Analysis
When the system is ready to be tested, press Run. The test will generate small
oscillations at different frequencies. When the test is complete, you can click
Ok and the Bode plot is generated. The figure below shows the usable
Bandwidth (-3dB point - green area of graph). The system analysis test shows a
grey line to show the -3dB point of your system.
•Line A - Figure 96 on page 229
shows the Line-A plot (Red curves). These
curves are the measurements after the System Analysis test is performed.
After each test is executed, these curves are the only values that change.
•Line B - Figure 96 on page 229
shows the Line-B plot. These curves are the
measurements before the System Analysis is performed. To transfer
these measurements from Line-A to Line-B, click >>.

 Loading...