536 Rockwell Automation Publication 2198-UM004D-EN-P - December 2022
Appendix E Use the Scope Function in KNX5100C Software
• The X-axis represents the frequency and the unit is Hz.
• The Y-axis represents the strength of the signal, which has no absolute
unit but is a relative value.
• The icons on the FFT Display toolbar function the same as the icons on
the Scope toolbar.
• Double-click any point of the FFT Display screen and all points display.
• You can also use the mouse to drag a rectangle and drop it on the screen
to display the frequency spectrum of the waveforms.
• The title bar of FFT Display window, such as FFT: 32768 Pts, indicates the
data number of the selected area. The larger the number, the better the
resolution (DPI™). We recommended a value of at least 512 or higher.
• The image of the FFT Display screen can also be saved as a picture (*.bmp
file). Place the cursor on the FFT Display screen, right-click the mouse,
and choose ‘Save as picture (*.bmp)’.
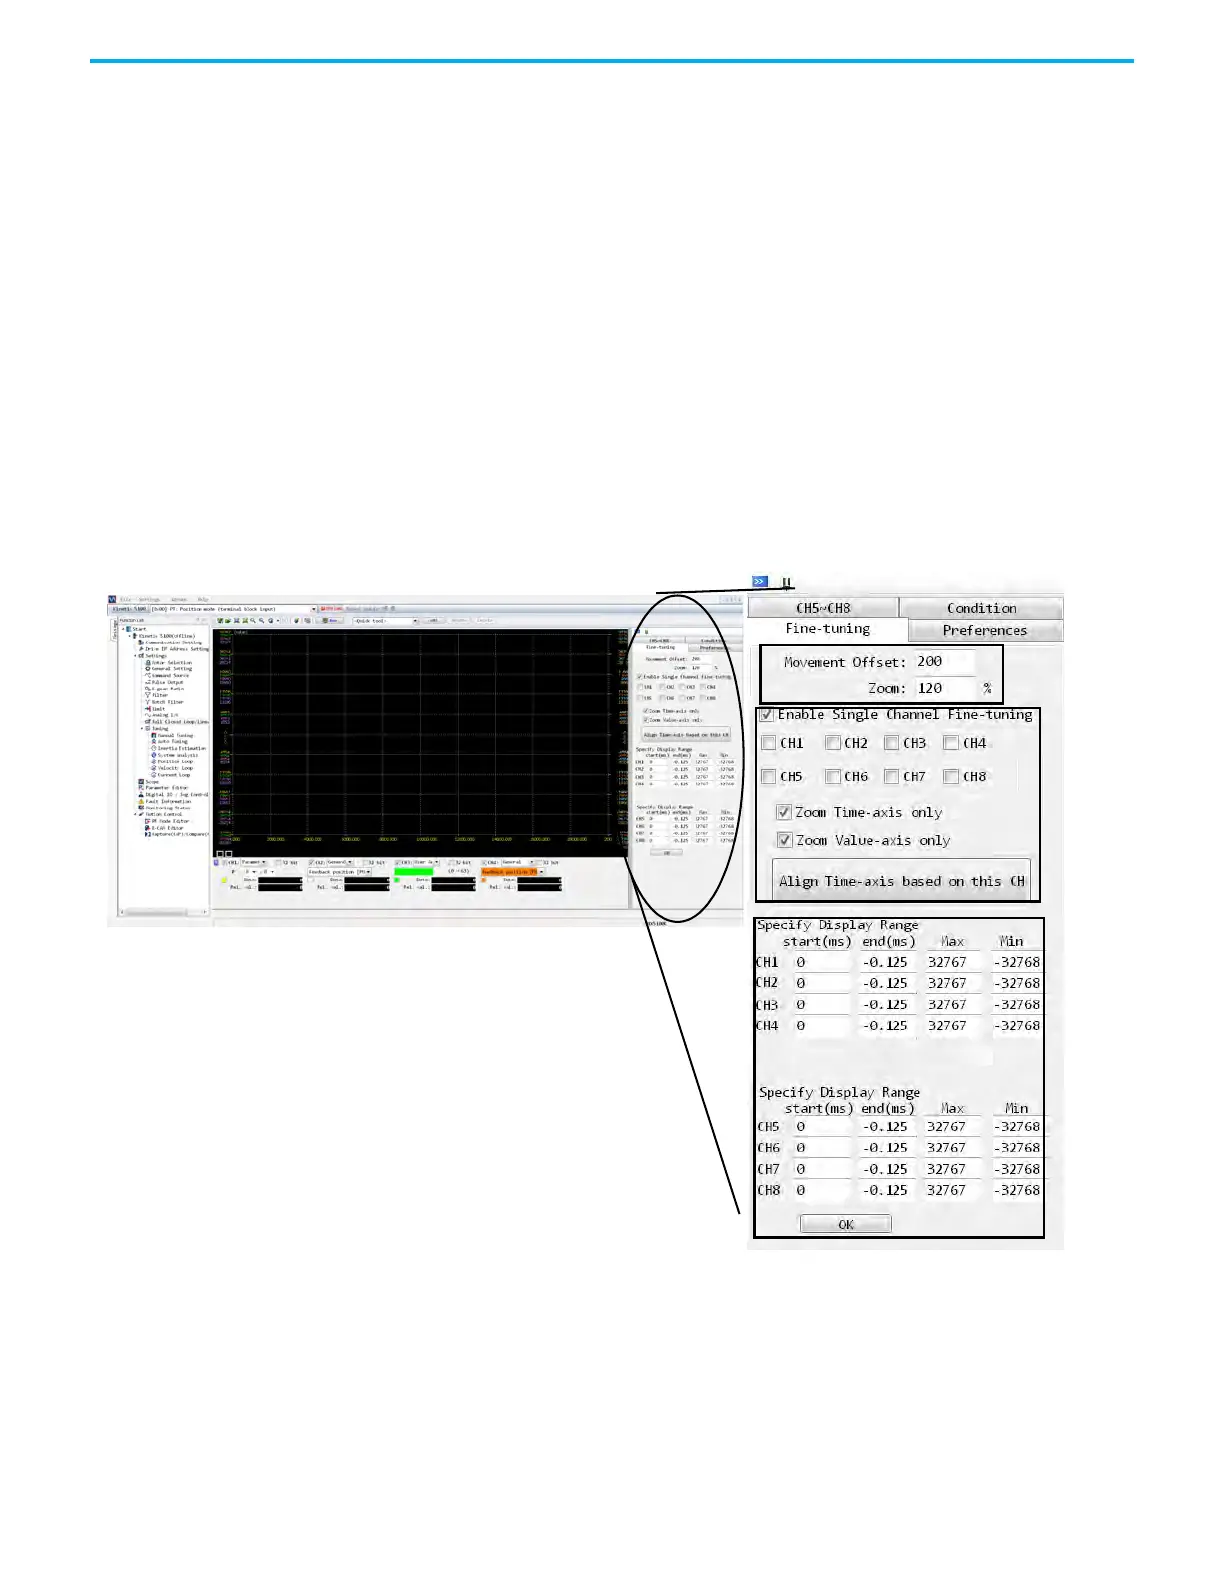
Fine-Tune the Scope When the other functions cannot meet your requirements, you can enable the
Fine-Tuning function.

 Loading...