Rockwell Automation Publication 2198-UM004D-EN-P - December 2022 201
Chapter 9 Tuning
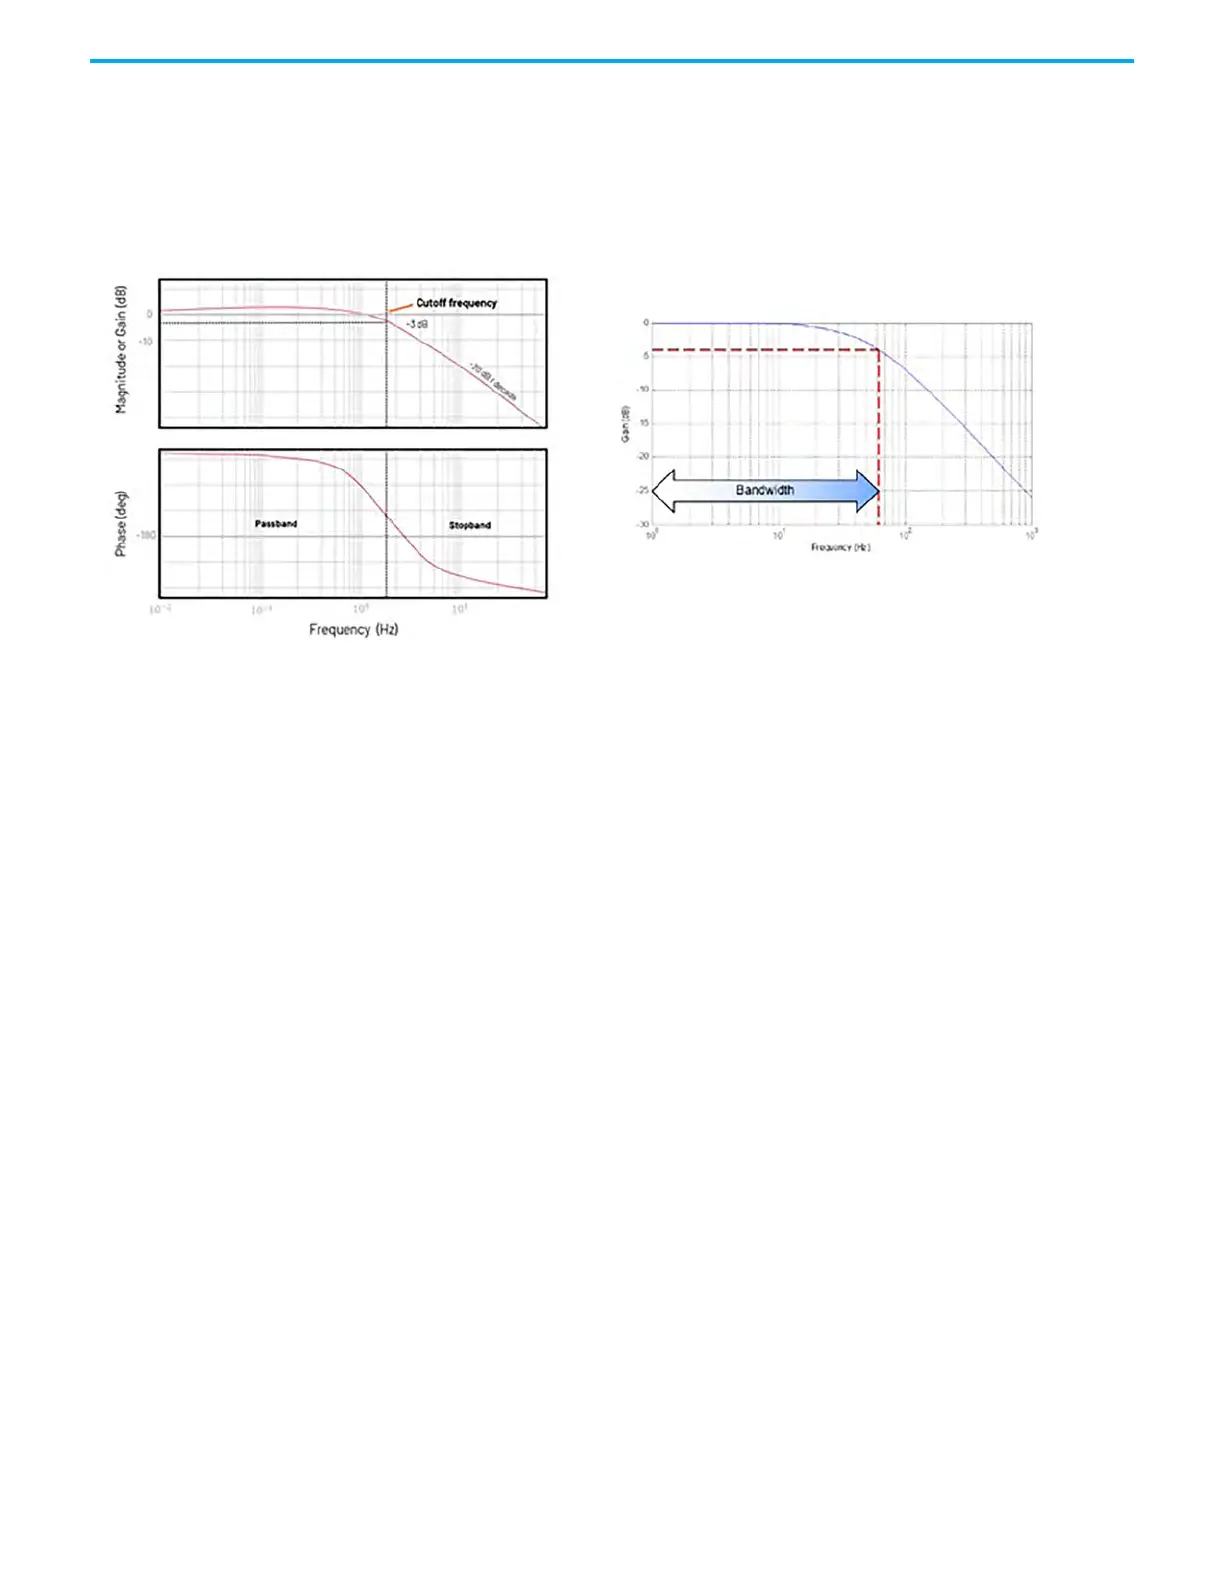
A good way to understand the characteristics of your system (and its
performance) is to use a Bode plot.
As shown in this bode plot using Hz (left), the usable bandwidth is the area
below the -3.0dB point and cutoff frequency. This same representation is
shown in Hz (right) and the bandwidth is indicated.

 Loading...