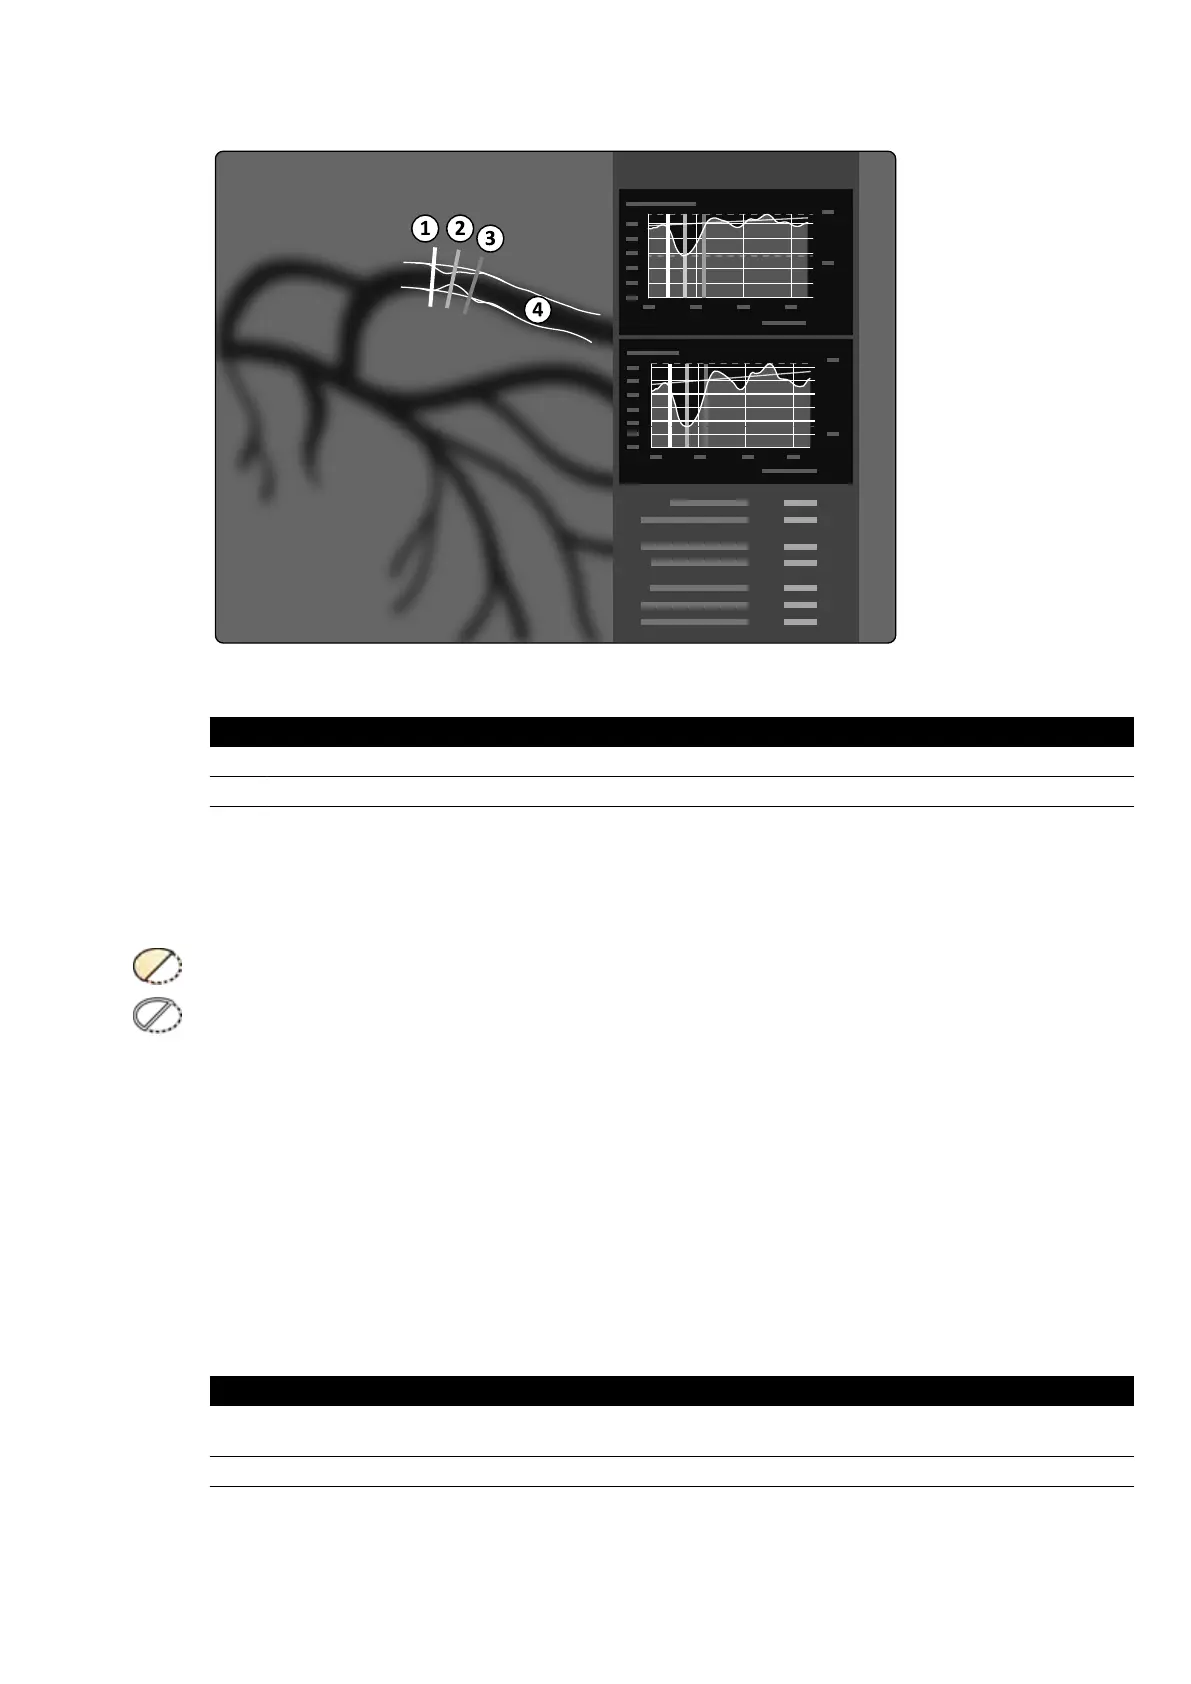
Figure 74 St
enosis measurement reference lines
Legend
1 Proximal boundary 3 Distal boundary
2 Minimum lesion diameter (MLD) 4 Contour
1 T
o reposion the point of stenosis, drag the minimum lesion diameter to a new posion.
2 To reposion the proximal boundary, drag the green reference line to a new posion.
3 To reposion the distal boundary, drag the blue reference line to a new posion.
4 To show or hide plaque within the segment, click Show/Hide Plaque in the control panel.
5 To show or hide the segment contour, click Show/Hide Contour in the control panel.
10.5.5 Result Task
Y
ou use the Result task to view analysis results from QCA and QVA.
The result page displays the analysis results, the analyzed image, and analysis graphs. Any warnings
associated with the analysis results are also displayed.
Accuracy of QCA / QVA Results
QCA
QCA Analysis Results Accuracy (S
ystemac Error) Precision (Random Error)
Vessel diameter < 0.2 mm (for diameters ≤ 1 mm)
< 0.1 mm (for diameters > 1 mm)
< 0.2 mm
Vessel segment length < 1.0 mm < 2.0 mm
Vessel diameter accuracy is specied f
or measurements performed on a vessel placed in the isocenter,
using automac calibraon.
2D Quant
ave Analysis (Opon) QCA / QVA
Azurion Release 1.2 Ins
trucons for Use 166 Philips Healthcare 4522 203 52421