Centerline Wall Moon R
esults (LVA / RVA)
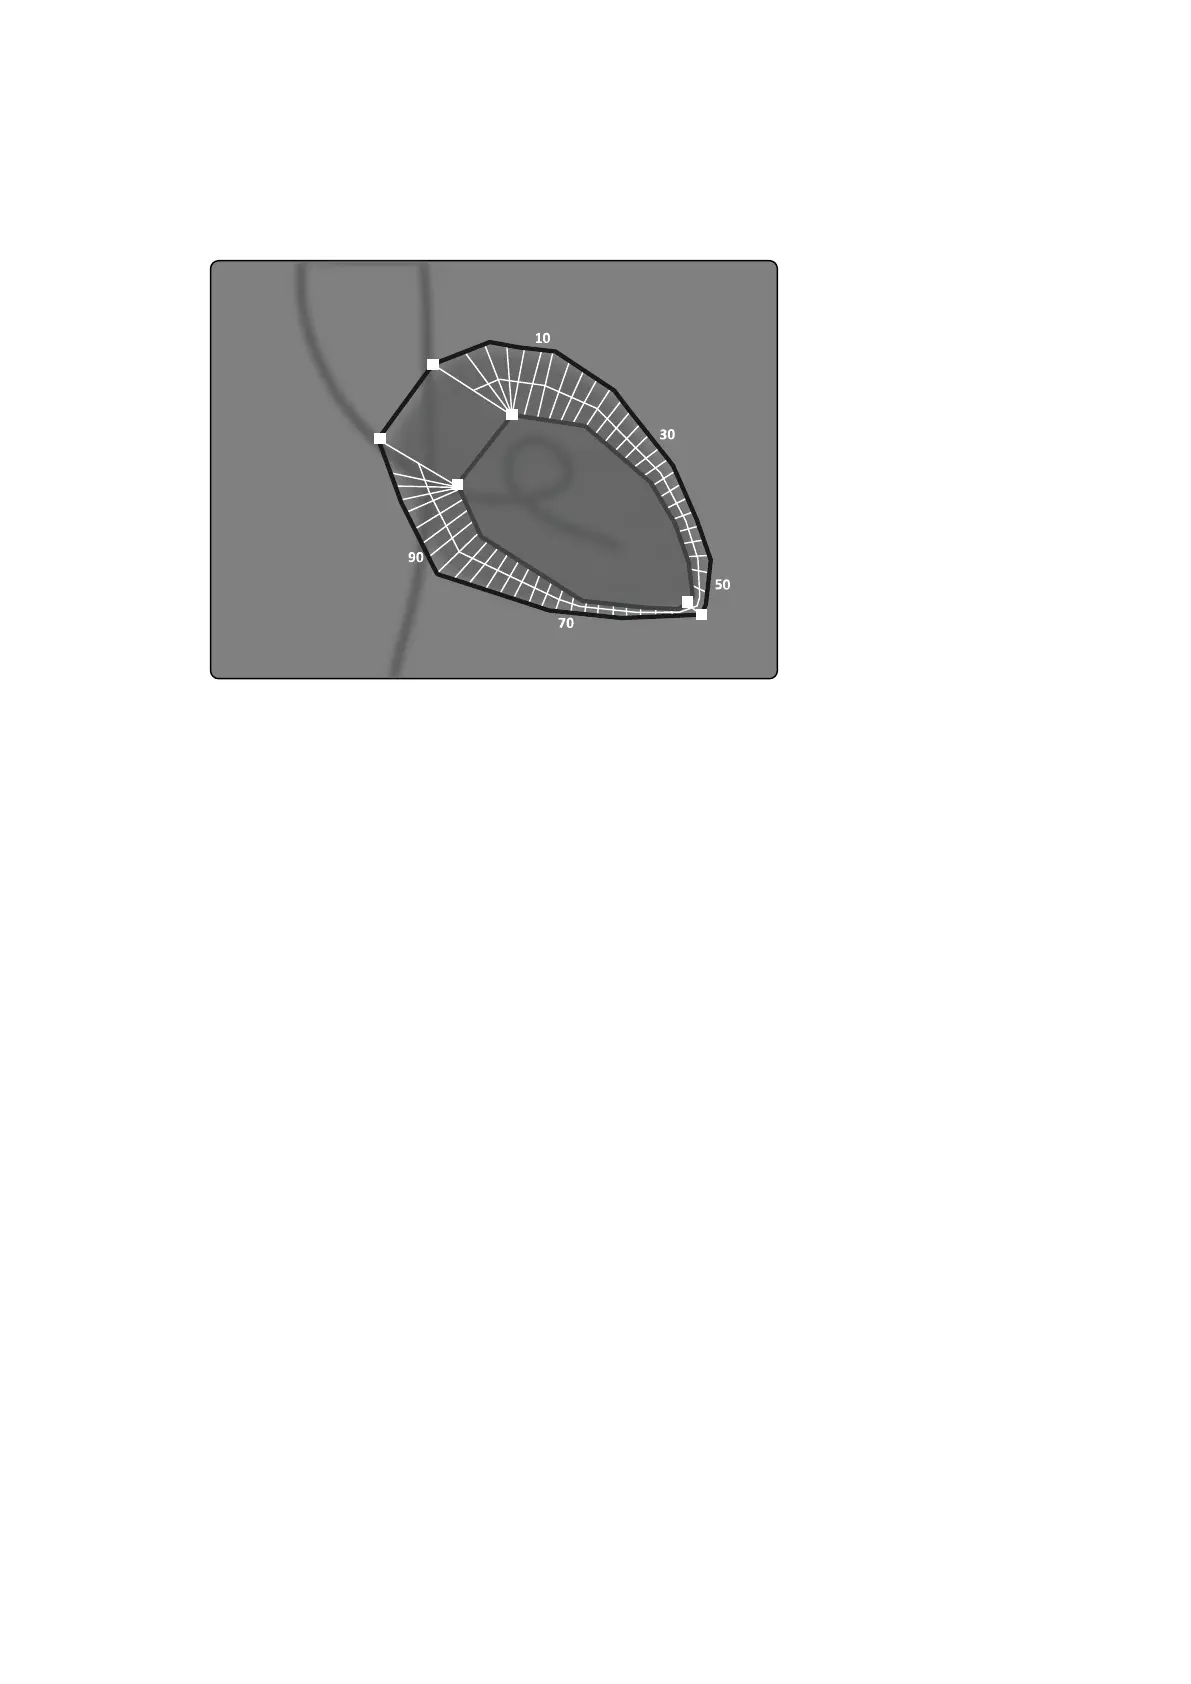
Centerline Wall Moon results can be displayed for both LVA and RVA. The result page includes an
image showing a representaon of the detected wall moon, a table showing kinec parts, and graphs
showing normalized moon and standard deviaon.
Figure 80 Cen
terline Wall Moon
The Centerline Wall Moon method is described in medical literature: Sheehan, F.H. “Advantages and
applicaons of the centerline method for characterizing regional ventricular funcon”.
The Centerline Wall Moon method describes the displacement between the ED and ES of parcular
points on the ventricular wall. The calculaons are based on images in standard RAO 30-degree
projecon, which is also required for the used volume calculaon.
Between the ED and ES contours a centerline is dened. 100 Equidistant chords perpendicular to this
centerline are dened. Only 50 chords are shown in the graphic display. The chords are dened in such
a way that they do not cross each other.
Besides the image with the contours and chords, a table indicates the hyperkinec parts (more than
two standard deviaons of normal movement) and the hypokinec parts (less than minus two standard
deviaons of normal movement).
Graphs are also displayed, indicang normalized moon and standard deviaon based on the lengths of
the chords. The vercal axis represents the length, the horizontal axis the locaon of the measurement
points over the ventricular wall.
In LVA results, the gray band represents the wall moon parameters for a normal populaon. The gray
band represents the wall moon parameters for a normal paent populaon, as described in the
above-menoned arcle by Sheehan. The gray band shows the average normal value ±2 standard
deviaons. This is not available in RVA results.
References
Computaons in 2D Quantave Analysis are performed according to methods described in medical
literature.
2D Quantave Analysis (Opon) LVA / RVA
Azurion Release 1.2 Ins
trucons for Use 180 Philips Healthcare 4522 203 52421