Slager Wall Moon R
esults (LVA only)
Slager Wall Moon results are calculated for LVA only. The result page includes an image showing a
representaon of the Slager wall moon model, and graphs showing color-coded informaon
concerning the contribuon to overall EF from each area of the heart wall.
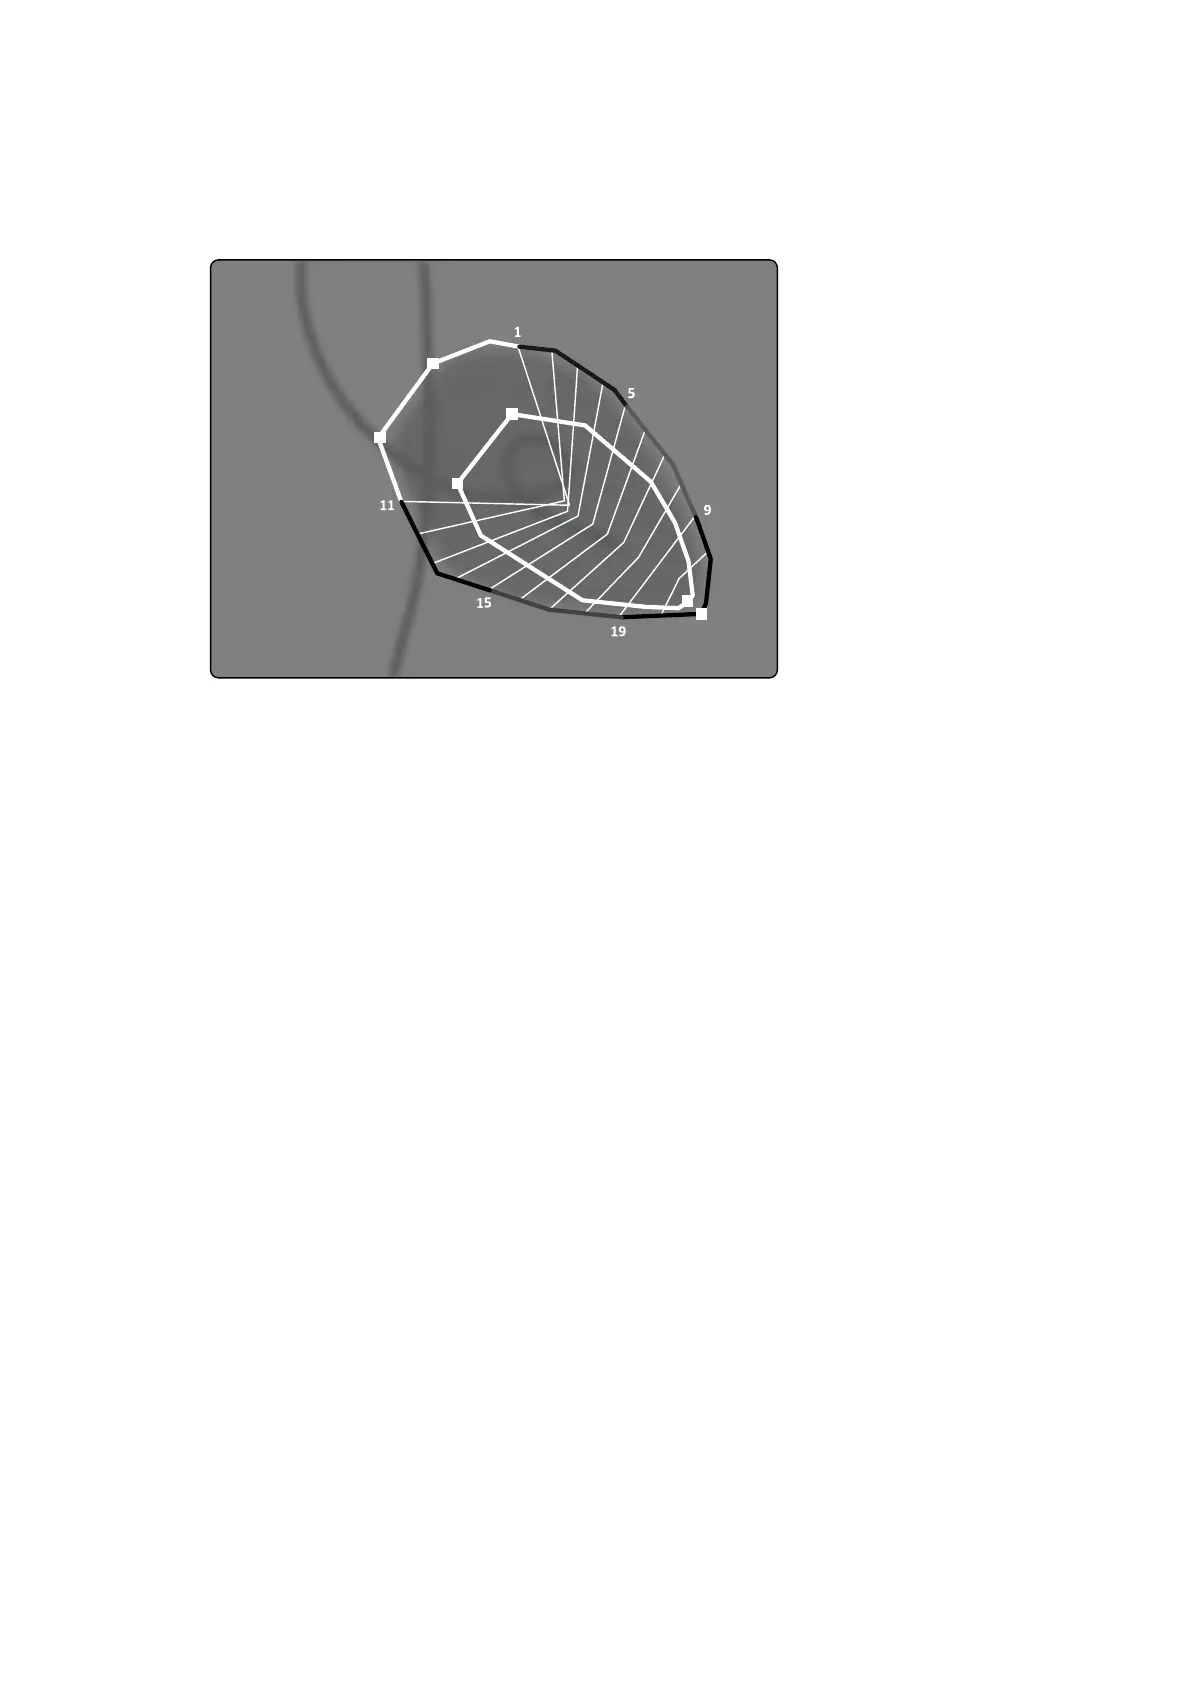
Figure 79 Slag
er Wall Moon
The Slager Wall Moon method is based on a contracon model and is described in medical literature:
• Slager, C.J., Hooghoudt, T.E.H., et al., “Quantave assessment of regional le ventricular moon
using endocardial landmarks”
• Slager, D.J., Hooghoudt, T.E.H., et al., “Le ventricular contour segmentaon from anatomical
landmark trajectories and its applicaon to wall moon analysis”
The method is used to describe the displacement between the end diastole and end systole of
parcular points on the le ventricular wall. The calculaons are based on images in standard RAO 30-
degree projecon, which is also required for the volume calculaon ulized.
The le side of the results page shows a composite graph of CREF (Regional Contribuon to global
Ejecon Fracon) values for the 20 segments. CREF values are derived from systolic wall displacement
data and le ventricular long-axis shortening. The individual anterior and posterior CREF values of the
paent are superimposed and connected by straight lines.
To compare the quantave results with those provided by the usual visual interpretaon, the le
ventricular boundary is divided into 5 anatomical regions, denoted Anterobasal, Anterolateral, Apical,
Diaphragmac, and Posterobasal. The segments are assigned to these regions and the CREF values for
the regions are ploed as well.
In LVA results, the gray band represents the wall moon parameters for a normal paent populaon,
collected by the Thorax Center, Erasmus University and the University Hospital Dijkzigt, Roerdam, The
Netherlands. The gray band shows the average normal value ±2 standard deviaons.
The le side of the results page shows the ED image chosen for le ventricular (EF) analysis with the
contours accepted during the analysis. Le ventricular segmental wall moon is computed along 20
straight lines, calculated from a mathemacal expression derived from anatomical landmark
trajectories in normal paents.
The 20 lines result from 20 well-dened ED contour points or segments, 10 anterior and 10 posterior.
The point or segment numbers are ploed along the contour. A center of contracon is dened for
each pair of 2 opposite ED contour points.
2D Quantave Analysis (Opon) LVA / RVA
Azurion Release 1.2 Ins
trucons for Use 179 Philips Healthcare 4522 203 52421