12.5 Trace Port
The PPC405GP implements a trace status interface to support the tracing of code running
in
real-
time. This interface enables the connection of an external trace tool, such as
RISCWatch, and allows
for user-extended trace functions. A software tool with trace capability, such as
RISCWatch with
RISCTrace, can use the data collected from this port to trace code running on the processor. The
result is a trace of the code executed, including code executed out
of
the instruction cache if it was
enabled. Information on trace capabilities, how trace works, and how to connect the external trace
tool is available in
RISCWatch Debugger User's Guide.
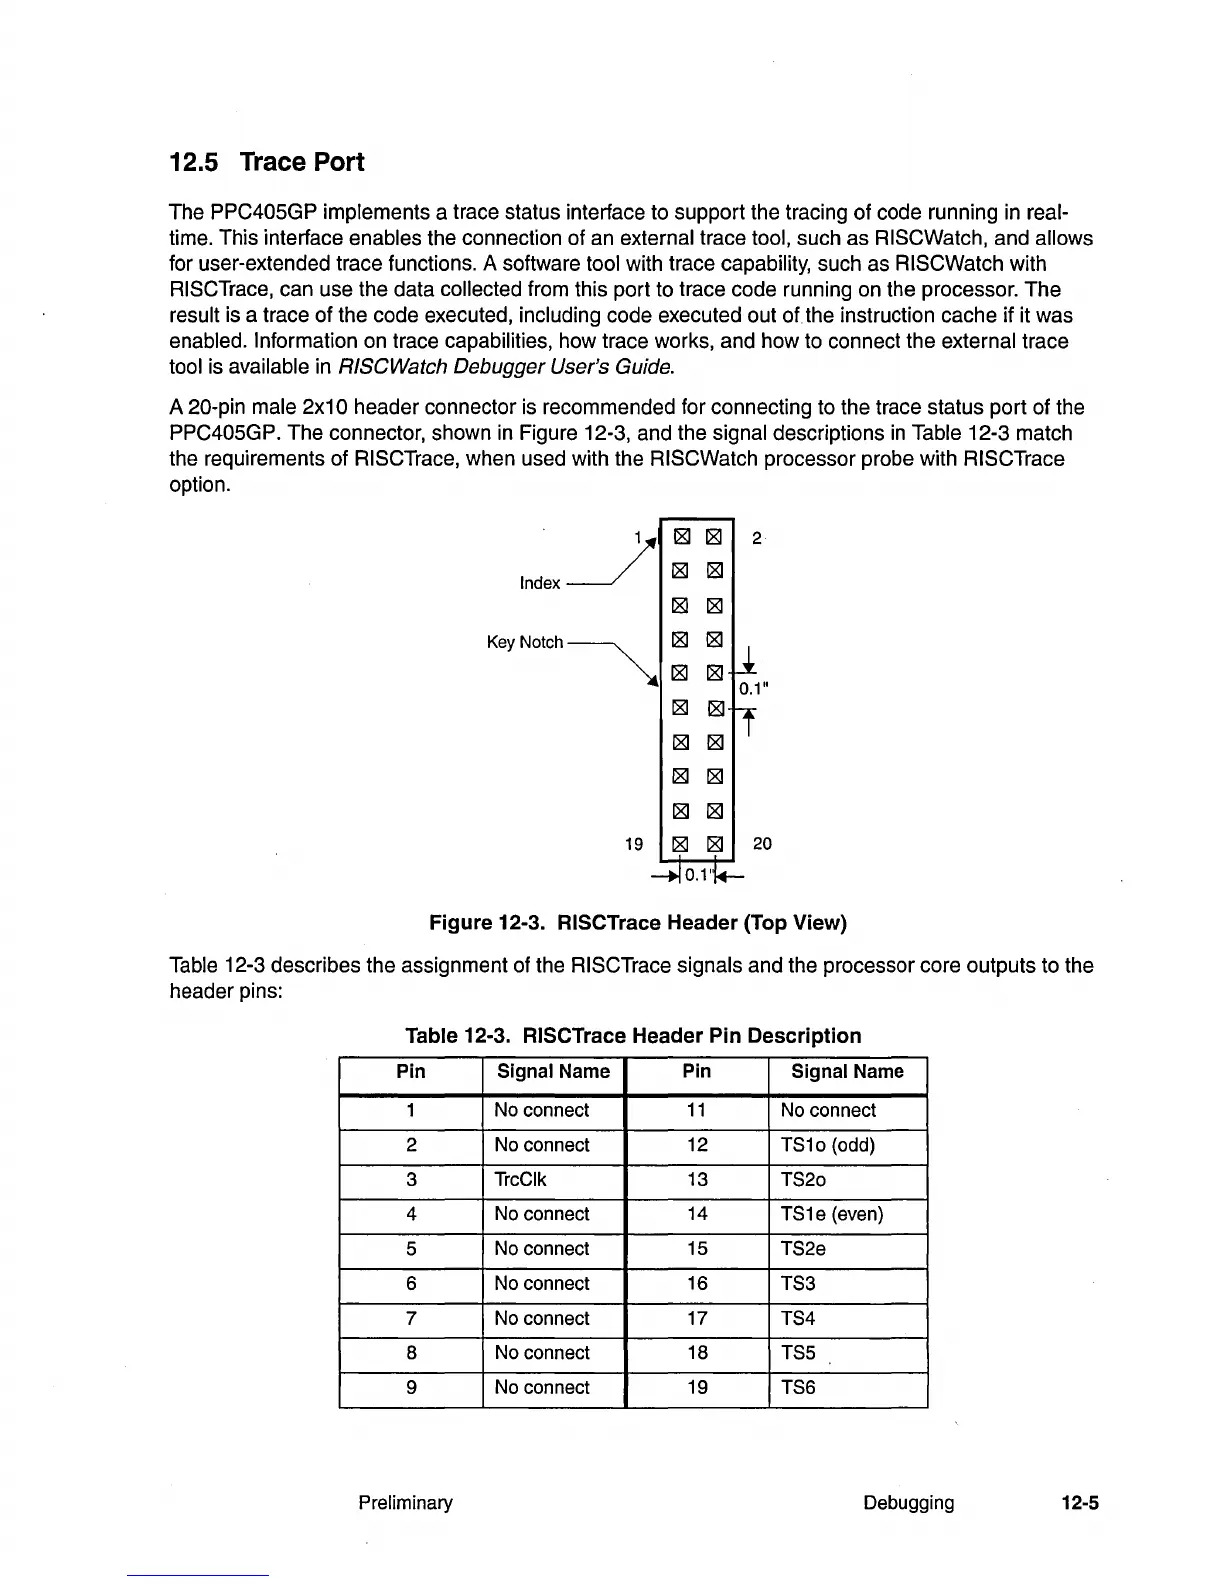
A 20-pin male 2x10 header connector is recommended for connecting to the trace status port of the
PPC405GP. The connector, shown
in
Figure 12-3, and the signal descriptions
in
Table 12-3 match
the requirements of
RISCTrace, when used with the RISCWatch processor probe with RISCTrace
option.
. 1
[8J
[8J
2
Index~
[8J [8J
[8J
[8J
KeYNotch~
[8J [8J
[8J [8J
[8J
[8J
[8J [8J
[8J
[8J
[8J [8J
19
[8J [8J
20
Figure 12-3.
RISCTrace Header (Top View)
Table 12-3 describes the assignment of the RISCTrace signals and the processor core outputs to the
header pins:
Table 12-3. RISCTrace Header Pin Description
Pin
Signal Name Pin
Signal Name
1 No connect
11
No connect
2 No connect 12
TS10 (odd)
3
TrcClk
13
TS20
4
No connect 14
TS1e (even)
5
No connect 15
TS2e
6
No connect
16
TS3
7 No connect 17 TS4
8
No connect 18
TS5
9
No connect 19
TS6
Preliminary
Debugging 12-5