Scan Recipes - Creating and Editing a Scan Recipe KLA-Tencor P-16+ / P-6 User’s Guide
3-54 KLA-Tencor Confidential 0142530-000 AB
3/13/09
3D General Parameters 3
These parameters represent calculations that are performed using the data from a
scan. If the options are chosen before the scan is performed, and are part of the scan
recipe, the calculations are automatically performed by the software and displayed in
the Analysis screen upon completion of the scan. The options can be applied to live or
saved data.
Each parameter option can be calculated in two different ways:
Full Scale: With this checkbox selected, the parameter are calculated using data
from the entire scan.
Boxed: With this checkbox selected, the parameter are calculated using data
from within the box that is defined in the 3D Cursors parameters window of the
Recipe Editor. (See Figure 3.42.)
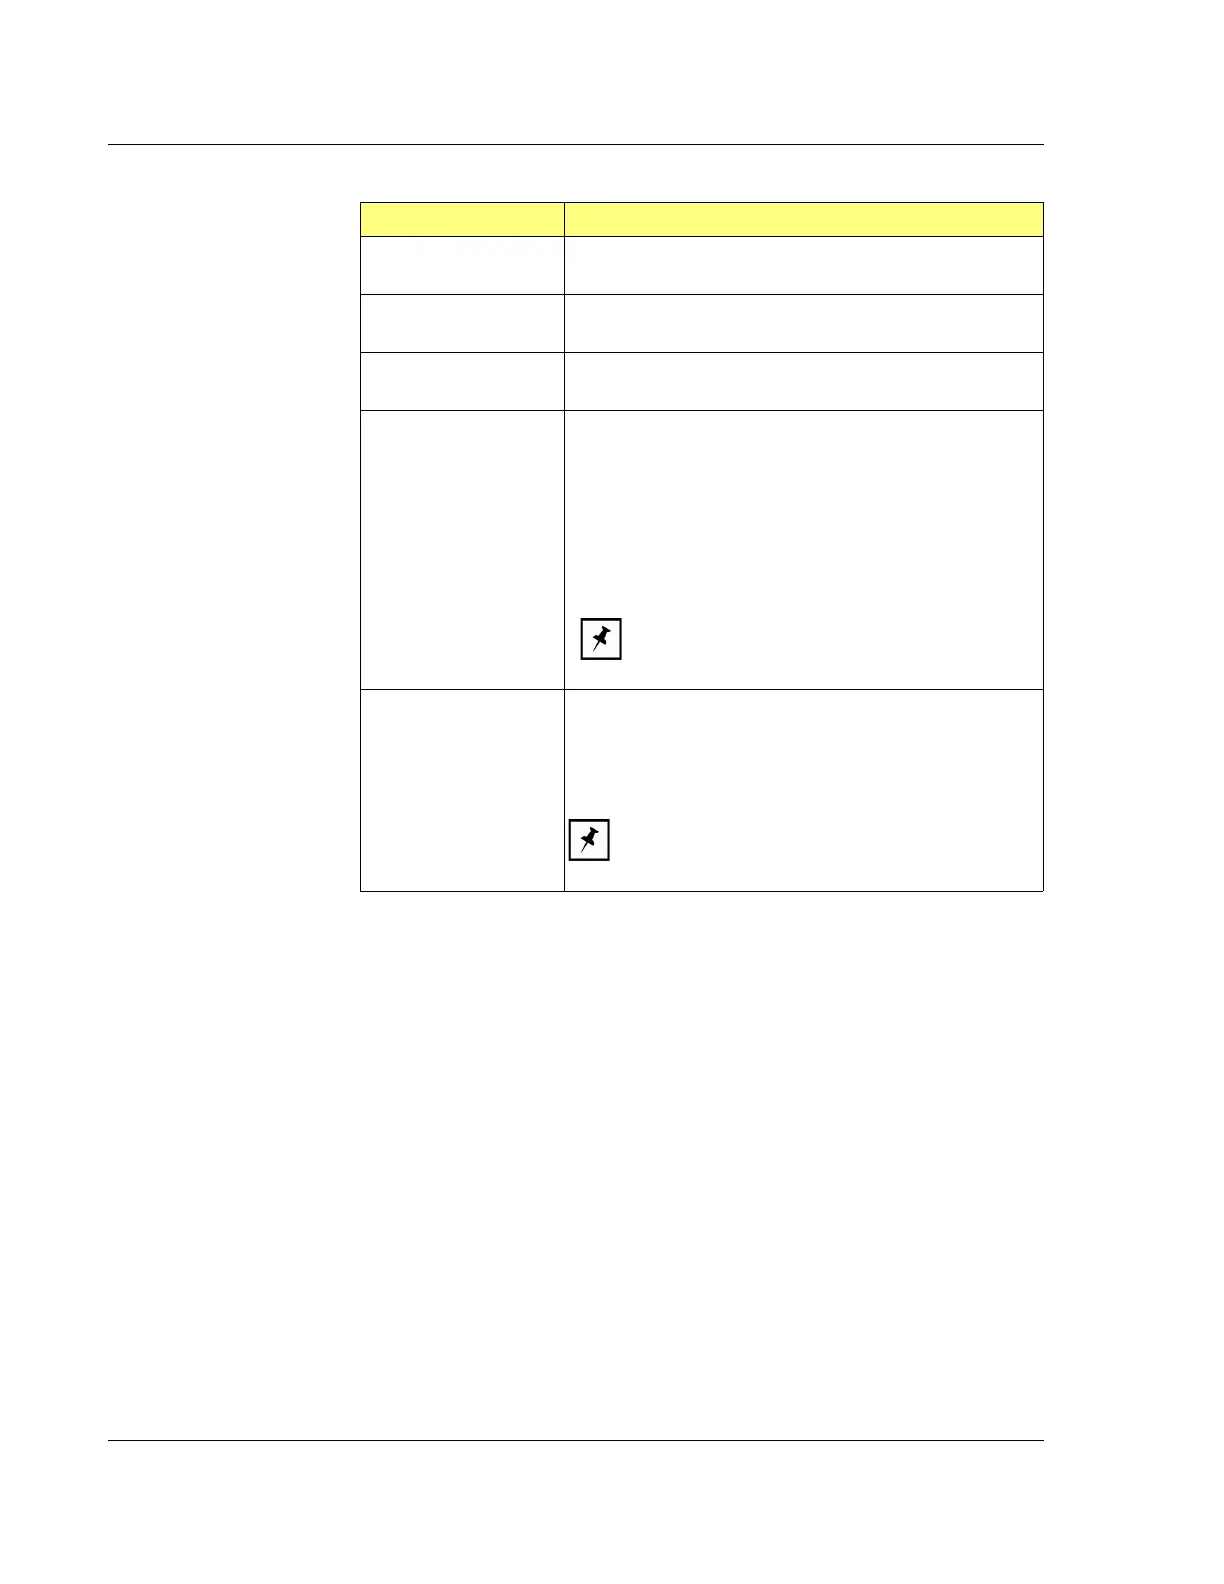
Peak (Pp) Maximum Z value, measured relative to the leveled reference
line, between the left and right measurement cursors.
Valley (Pv) Minimum Z value, measured relative to the leveled reference
line, between the left and right measurement cursors.
Profile Length (ProfL) The length that would be obtained from drawing out the profile in
a straight line. (ANSI)
Distance to Edge (Edge) Depending on the parameters settings in
Feature Detection,
this distance is either:
The distance between the beginning of the scan and
the first rising or falling edge of a profile feature; or
The distance between the beginning of the scan and
the first concave or convex arc of a profile feature.
Distance to the model reference point.
NOTE: This parameter is independent of the
cursor positions. It is based on the feature
detection parameters.
Step Width (StpWt) The distance between the first rising edge of an upward step
and the falling edge that follows, or the first falling edge of a
downward step and the rising edge that follows. This value is
not available for a convex or concave arc, bump, and model
feature detection.
NOTE: This parameter is independent of the
cursor positions. It is based on the feature
detection parameters.
Table 3.22 2D General Parameters (Continued)
Parameter Description
The green trace represents
Waviness.
The blue trace represents
Roughness.
 Loading...