0142530-000 AB KLA-Tencor Confidential 7-1
3/13/09
KLA-Tencor P-16+ / P-6 User’s Guide Analyzing 3D Scan Data - Introduction
ANALYZING 3D SCAN DATA Chapter 7
7
INTRODUCTION 7
The 3D scan data analysis displays the 3D scan image and trace information after a
scan is completed. A 3D scan is an image built by taking a series of 2D scans,
arranged in a raster pattern, to form a picture of the sample surface at the scan
location. With 3D analysis, complete surface analysis can be performed.
STARTING THE 3D ANALYSIS APPLICATION 7
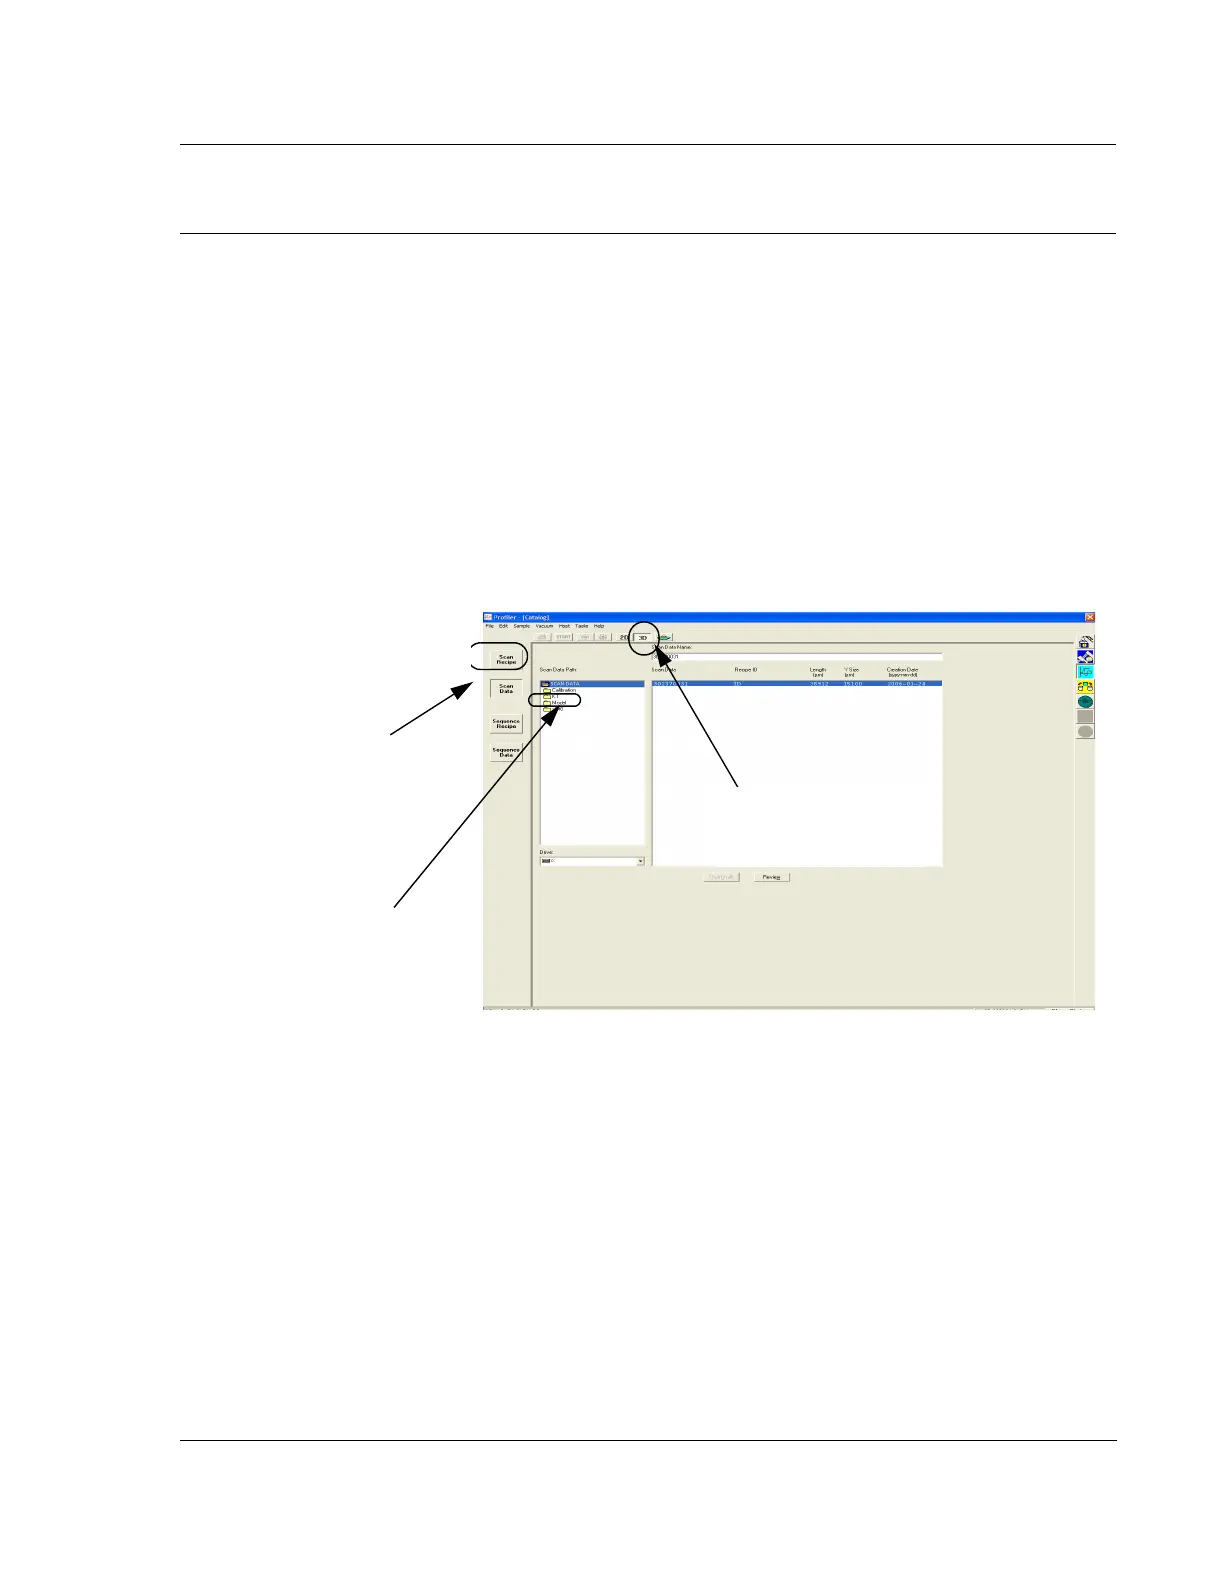
1. Click the Scan Data or Sequence Data command button to display the data
information in the Catalog window. (See Figure 7.1.)
2. Click the
3D button. (See Figure 7.1.)
3. In the
Scan Data Path column, click the folder name. (See Figure 7.1.)
4. In the
Scan Data list, click a data set to be analyzed.
Figure 7.1 Scan Catalog Screen with Scan Data Active.
Step 1 Click the Scan
Data
button to display the
Scan Data list in the
information window.
Step 2 Click the 3D button
to display the 3D list in the
information window.
Step 3 Click to choose the
required data folder.