3D Stress (optional Feature, P-16+ only) - KLA-Tencor P-16+ / P-6 User’s Guide
10-14 KLA-Tencor Confidential 0142530-000 AB
3/13/09
There are several other useful icons in the toolbar. These allow the user to show and
position the wafer notch or flat and also to change the values used for the calculation
of 3D Stress.
The icon produces a dialogue box in which the location of the wafer attribute
can be changed.
The icon produces the 3D Stress dialogue box where the user can modify the
stress units, wafer and film thicknesses as well as the Substrate Specifications. See
Figure 10.14.
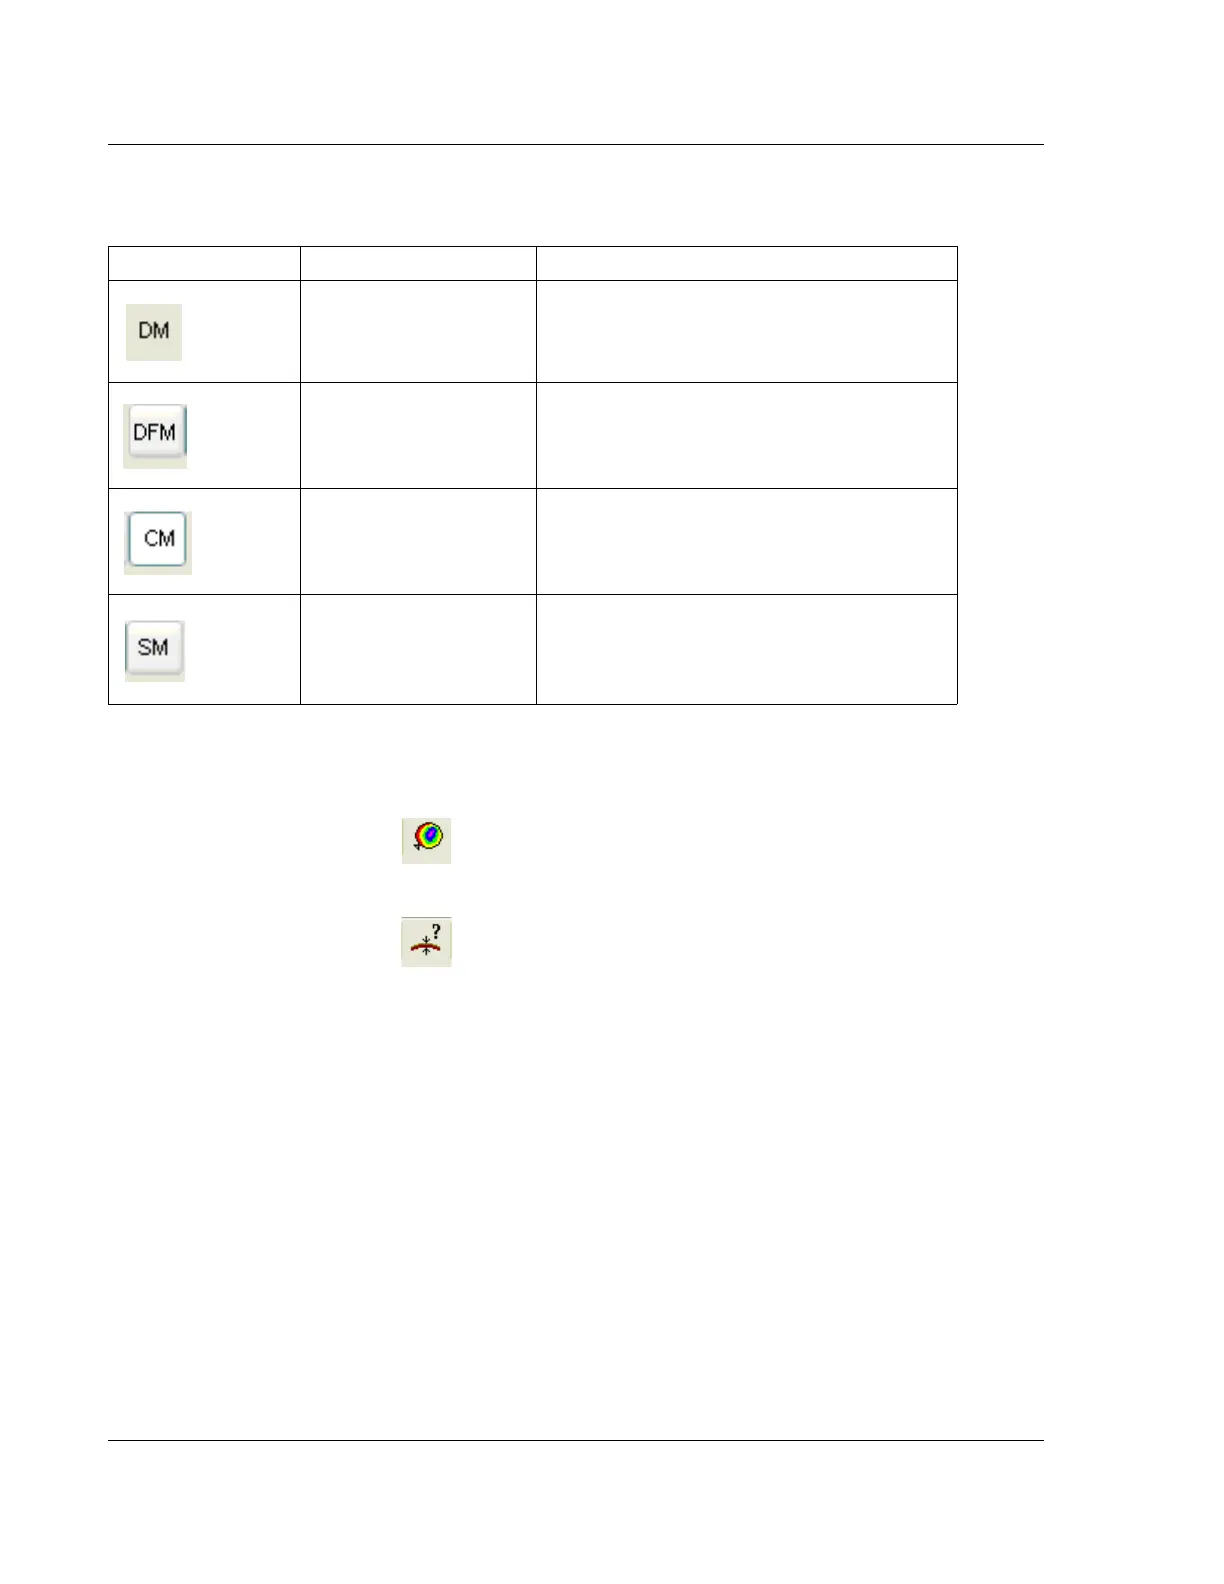
Table 10.6 Tool Bar Icons for Adjusting Image Rendered
Graphic Icon Name Description
Difference Map Renders the topography difference between the
pre and post scan data.
Deflection Map Renders the change in bow between the pre and
post scan data.
Curvature Map Renders the difference in curvature between the
pre and post scan data.
Stress Map Renders the stress between the pre and the post
scan based on Stoney's equation.