Scan Recipes - Histogram Depth KLA-Tencor P-16+ / P-6 User’s Guide
3-76 KLA-Tencor Confidential 0142530-000 AB
3/13/09
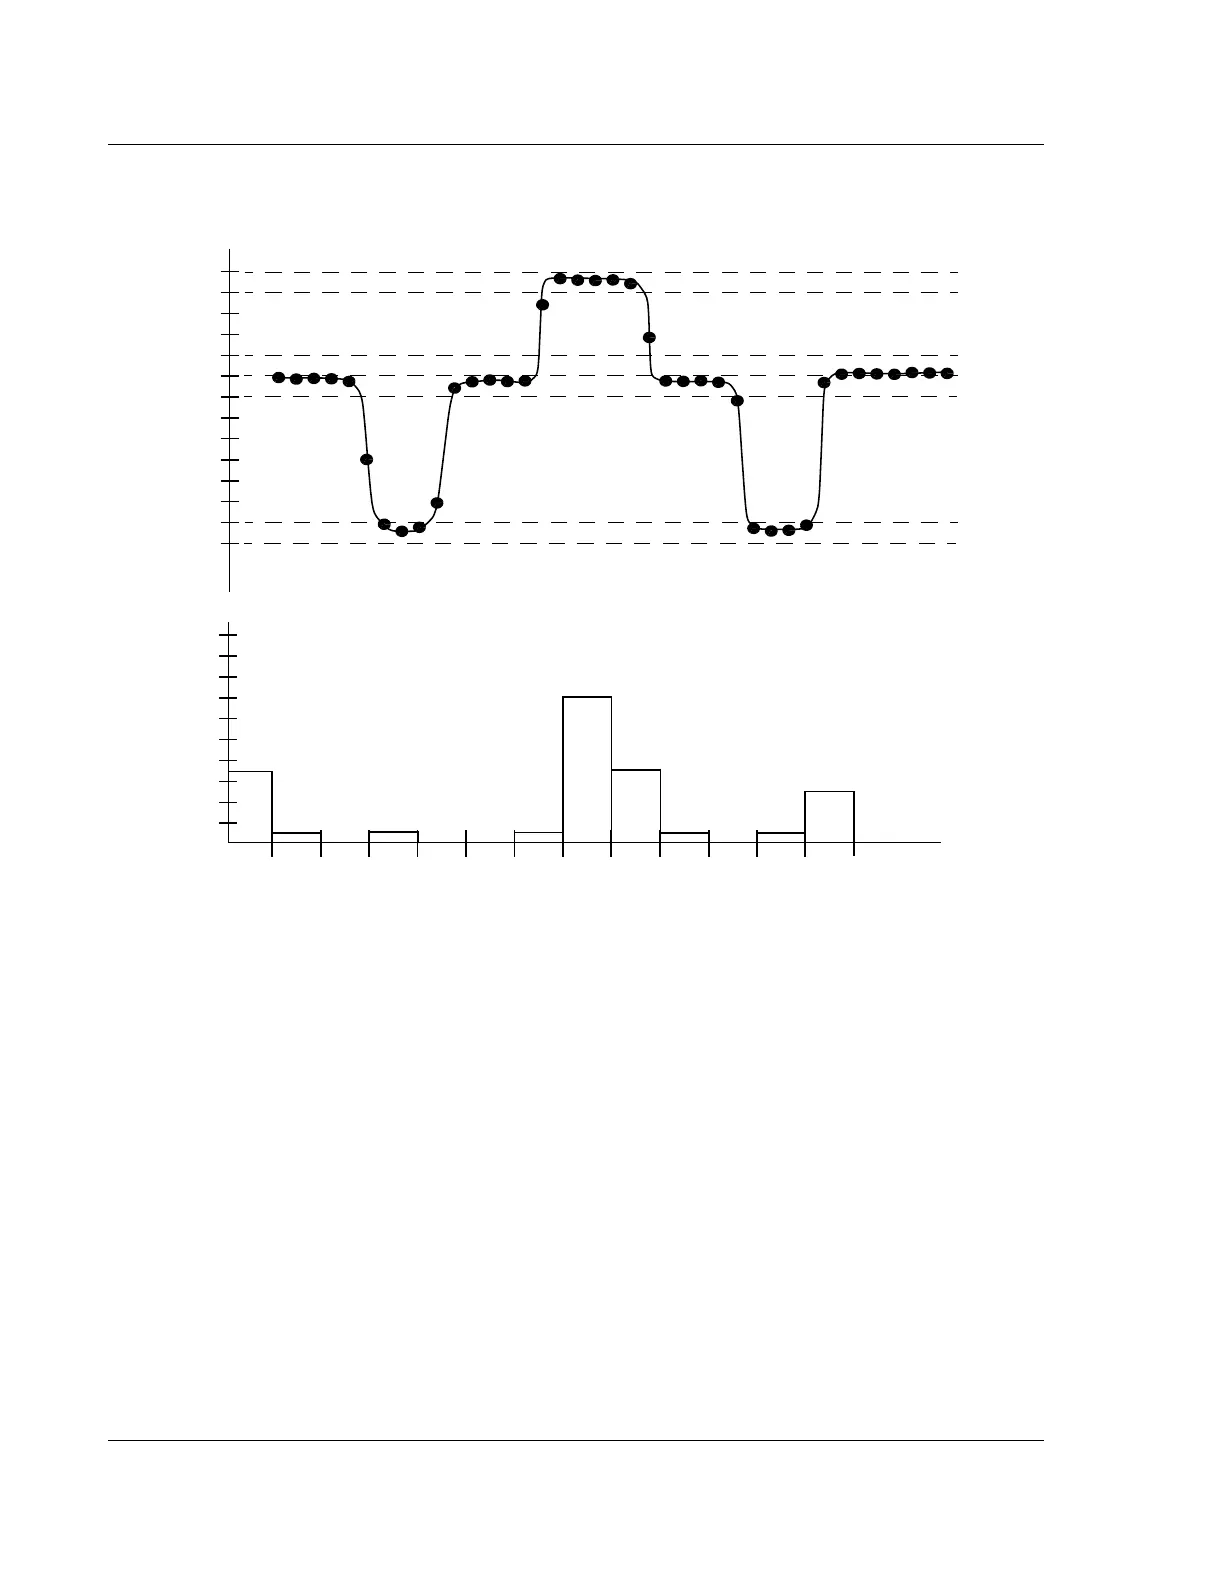
In the Histograms, the different planes (modes) are color coded for easy
reference and identification. The Histogram is displayed in green. The major
modes, when displayed, appear in red.
6. After all adjustments are complete, click
OK to save the changes, or Cancel to
discard the changes.
HISTOGRAM DEPTH 3
The Histogram Depth tool is used in the analysis of the gathered data to calculate step
height for two reference planes. The data is compiled as a histogram for calculating
the feature depth in a way similar to the Histogram Leveling tool. Users can check the
Enable Depth 1 Calculation checkbox to set up the first depth calculation, and select
the Enable Depth 2 Calculation checkbox to set up the second depth calculation.
See Figure 3.61.
Figure 3.60 Histogram of a Scan
Number of data points in
each bin.
2
10
6
8
4
12
14
16
18
20
Z Max
Z Mid
Z Min
Z Min
Lowest Plane (Mode)
Z Mid
Most Populous Plane (Mode)
Z Max
Highest Plane (Mode)
12345678 910111213Bin Number
Depth of Scan