3D Stress (optional Feature, P-16+ only) - KLA-Tencor P-16+ / P-6 User’s Guide
10-12 KLA-Tencor Confidential 0142530-000 AB
3/13/09
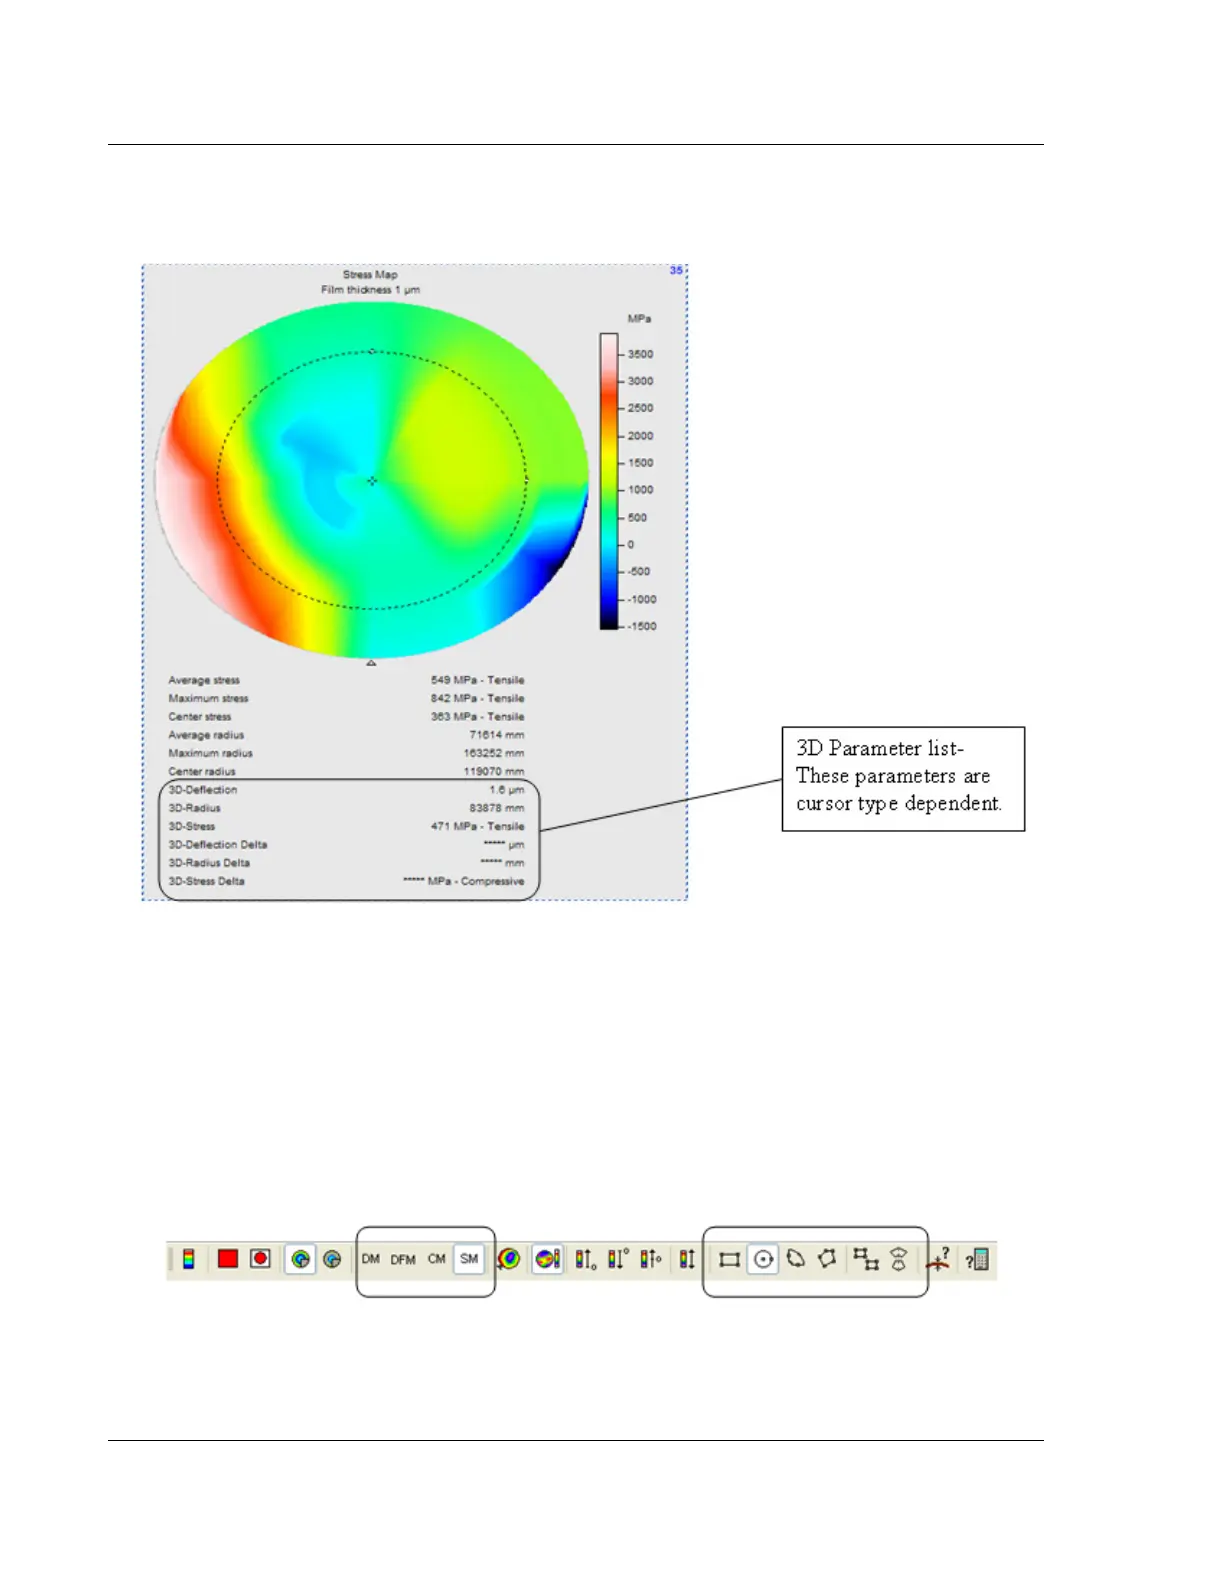
The stress values are automatically calculated in the 3D Stress Map. The Average
Maximum and Center parameters are based on the entire surface and do not change
with cursor location. However, the availability of the 3D parameters are cursor
dependent, and the type of cursor used can be changed via the Apex toolbar. Figure
10.13 displays the 3D Stress toolbar in the Apex software, with the commonly used
buttons highlighted.
Table 10.5 defines and describes the toolbar icons used to change the shape and
number of cursors to calculate the 3D parameters in the Stress Map image.
Figure 10.12 Stress Map Calculated by Apex Software
Figure 10.13 3D Stress Toolbar in Apex Software