0142530-000 AB KLA-Tencor Confidential 3-81
3/13/09
KLA-Tencor P-16+ / P-6 User’s Guide Scan Recipes - CMP Analysis
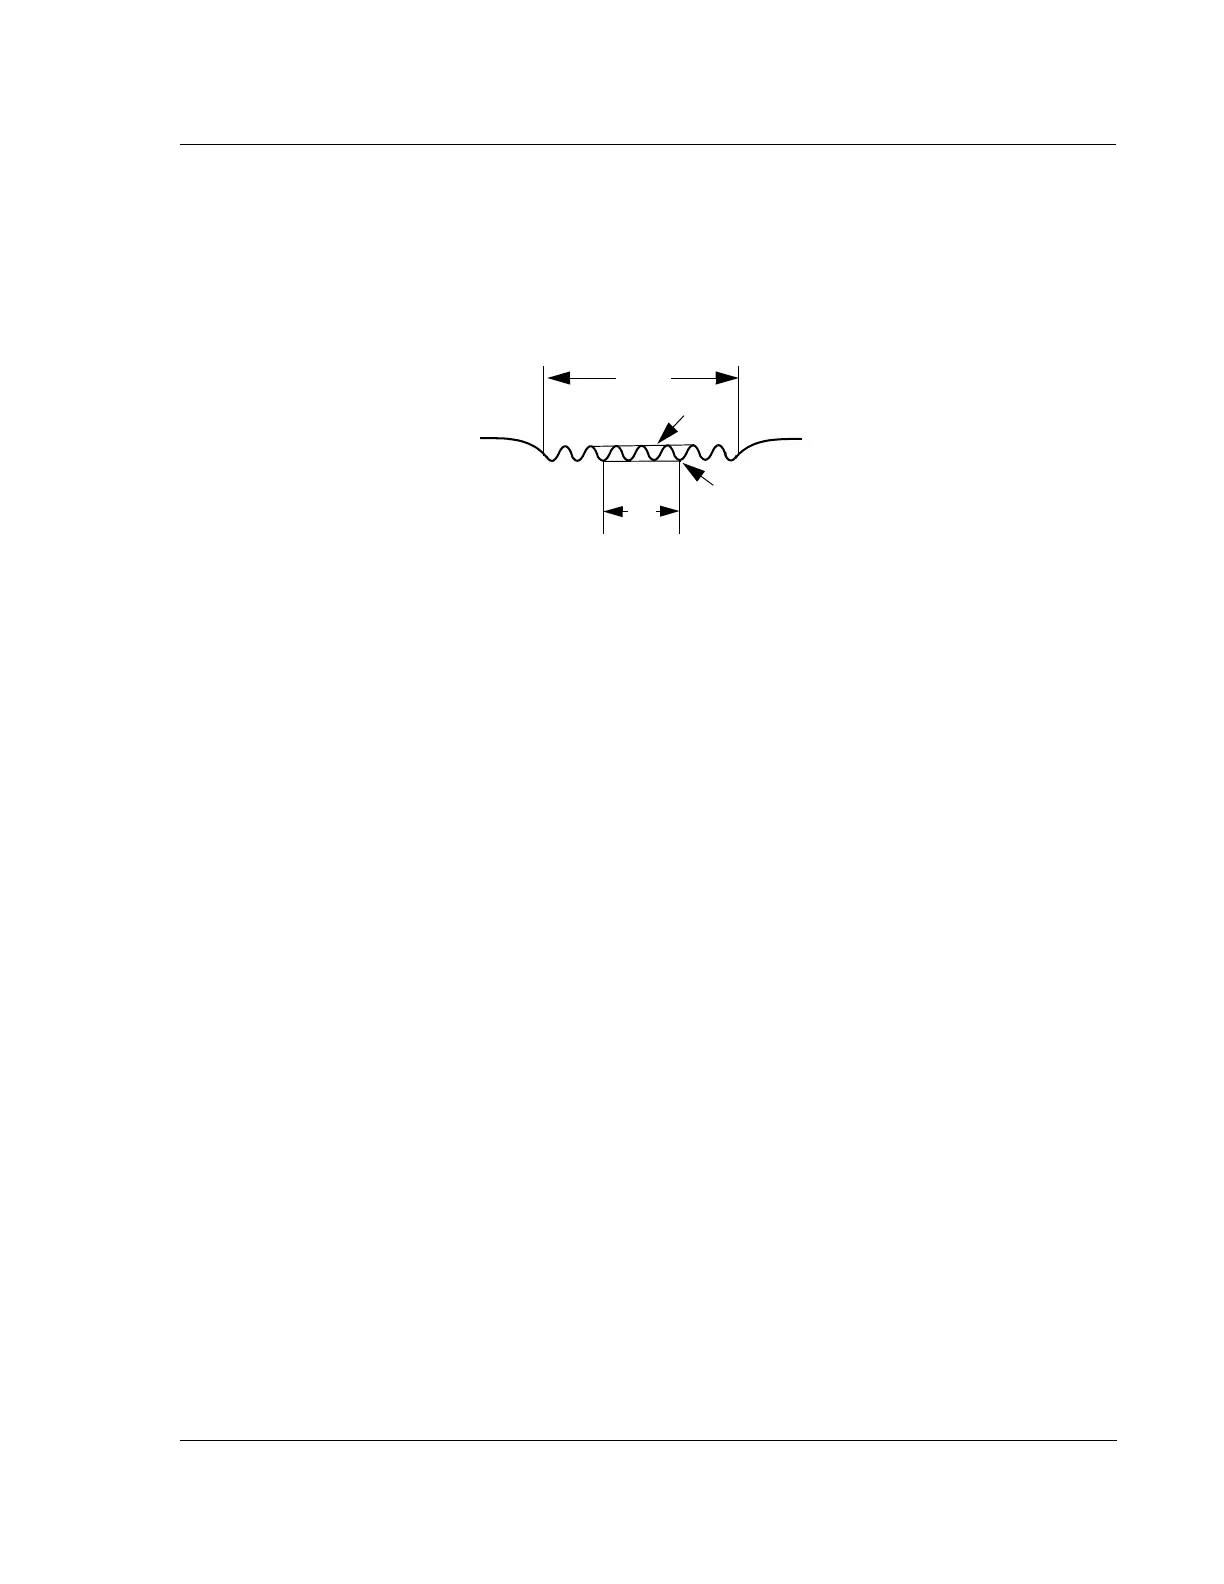
1. The “erosion region” (ER) is found by determining the minimum and
maximum slopes in the profile.
2. The “calculations region” (CR) is defined as some fraction of the ER.
3. Determine the local maxima within the CR.
4. Determine the local minima within the CR.
5. Using the local maxima, interpolate to obtain a curve that fits those
points (curve A).
6. Using the local minima, interpolate to obtain a curve that fits those points
(curve B).
7. Calculate the average of curve A. This is the erosion value.
8. Calculate the average of curve B. Subtract the erosion value from this
average to obtain the recess value.
Figure 3.65 ER and CR