11. VECTOR DISPLAY
236
11.13 Histogram Display
To display histograms, press VECT, F•1 VECT INTEN/CONFIG, and then F•1 VECTOR DISPLAY
to select HISTOGRAM.
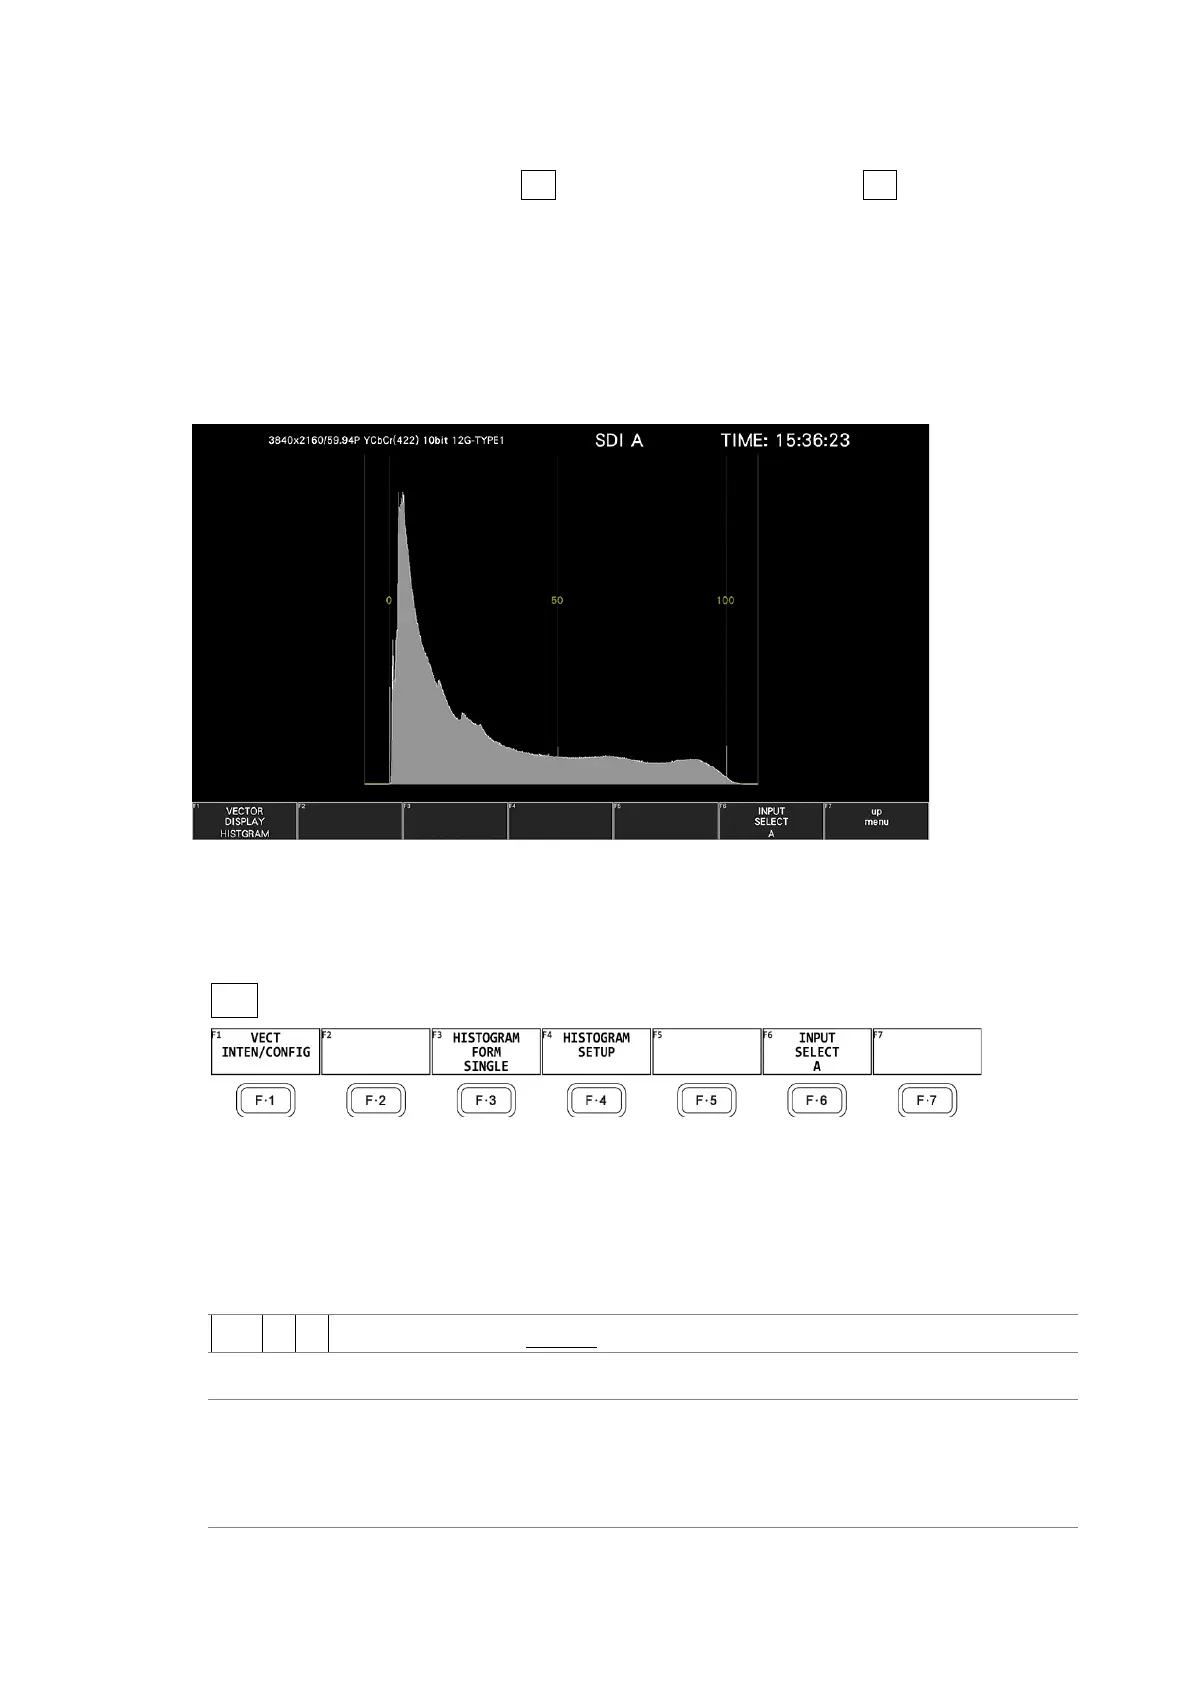
The histogram display shows the image data distribution by plotting the luminance level and
R, G, B levels on the horizontal axis and the number of pixels at each luminance level and R,
G, B level on the vertical axis.
If SER23 is installed, you can change the horizontal scale. See section 14.2.2, “Histogram
Display.”
Figure 11-26 Histogram Display
• Menu
Use the VECT menu to configure the histogram display settings.
VECT →
Figure 11-27 Vector menu
11.13.1 Selecting the Display Format
To select the display format, follow the procedure below.
Procedure
VECT → F•3 HISTOGRAM FORM: SINGLE / TILE / ALIGN_H / ALIGN_V
Settings
SINGLE: Luminance, R, G, or B is displayed.
TILE: Luminance, R, G, and B are displayed in tiles.
ALIGN_H: Luminance, R, G, and B are displayed side by side.
ALIGN_V: Luminance, R, G, and B are displayed top to bottom.