12. CIE Chromaticity Diagram Display (SER22)
239
12. CIE CHROMATICITY DIAGRAM DISPLAY (SER22)
To display the CIE chromaticity diagram, press VECT, F•1 VECT INTEN/CONFIG, and then F•1
VECTOR DISPLAY to select CIE DIAGRAM.
When VECTOR DISPLAY is set to VECT, 5BAR or HISTOGRAM, see 11, “CIE Chromaticity
Diagram Display,” for the explanation.
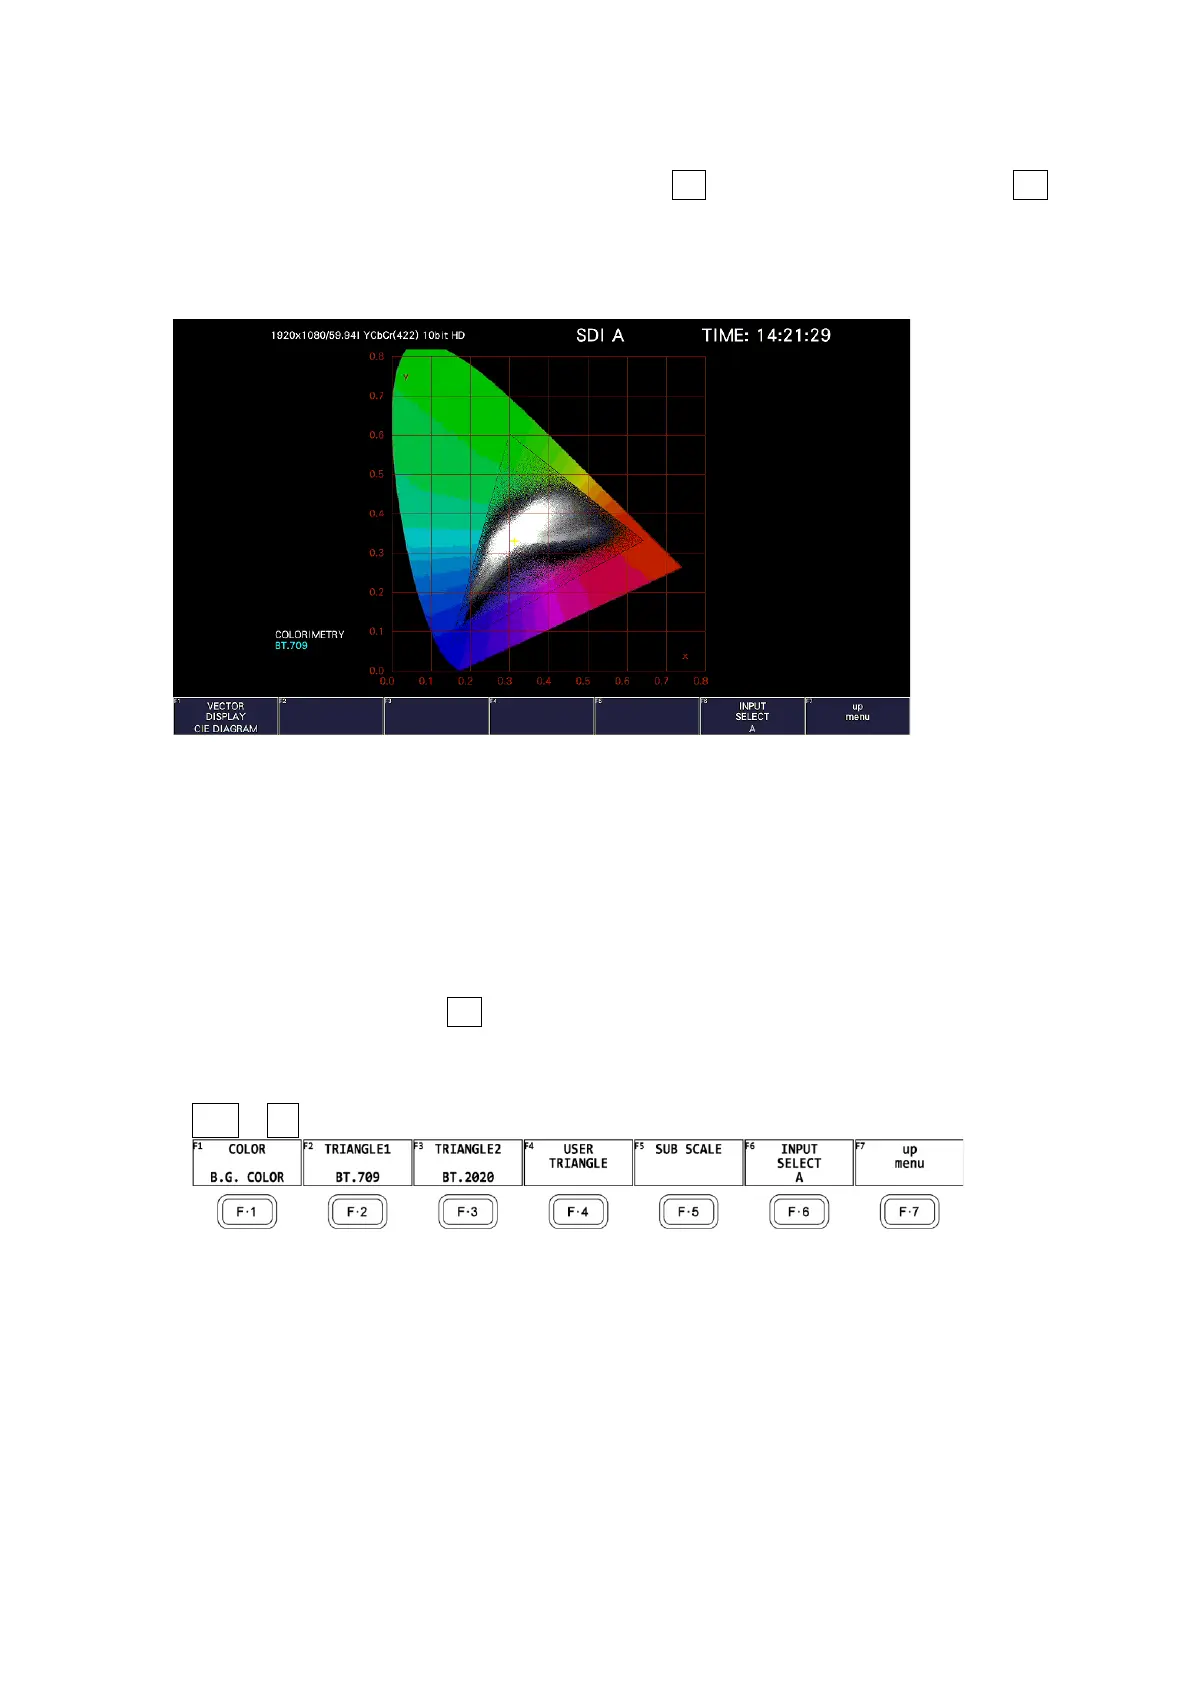
Figure 12-1 CIE chromaticity diagram display
• Colorimetry
The colorimetry selected on the SYS menu is displayed in cyan in the lower left of the screen.
However, for 3G(DL)-4K, the current applied colorimetry is displayed in yellow if the
colorimetry information of all links specified by the payload ID are not matched.
12.1 Setting the Scale
To configure the scale, use F•2 CIE DIAGRAM SCALE on the VECT menu.
This menu item does not appear when DISPLAY MODE is set to TEMP.
[See also] DISPLAY MODE → 12.2.1, “Selecting the Display Mode”
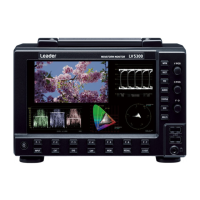
VECT → F•2 CIE DIAGRAM SCALE →
Figure 12-2 CIE DIAGRAM SCALE menu