12. CIE Chromaticity Diagram Display (SER22)
241
12.1.2 Selecting the Triangle
To display up to three color triangles, follow the procedure below.
Procedure
VECT → F•2 CIE DIAGRAM SCALE
→ F•2 TRIANGLE1: BT.601(525) / BT.601(625) / BT.709 / DCI / BT.2020 / OFF
→ F•3 TRIANGLE2: BT.601(525) / BT.601(625) / BT.709 / DCI / BT.2020 / OFF
→ F•4 USER TRIANGLE → F•1 TRIANGLE: 1 / 2 / OFF
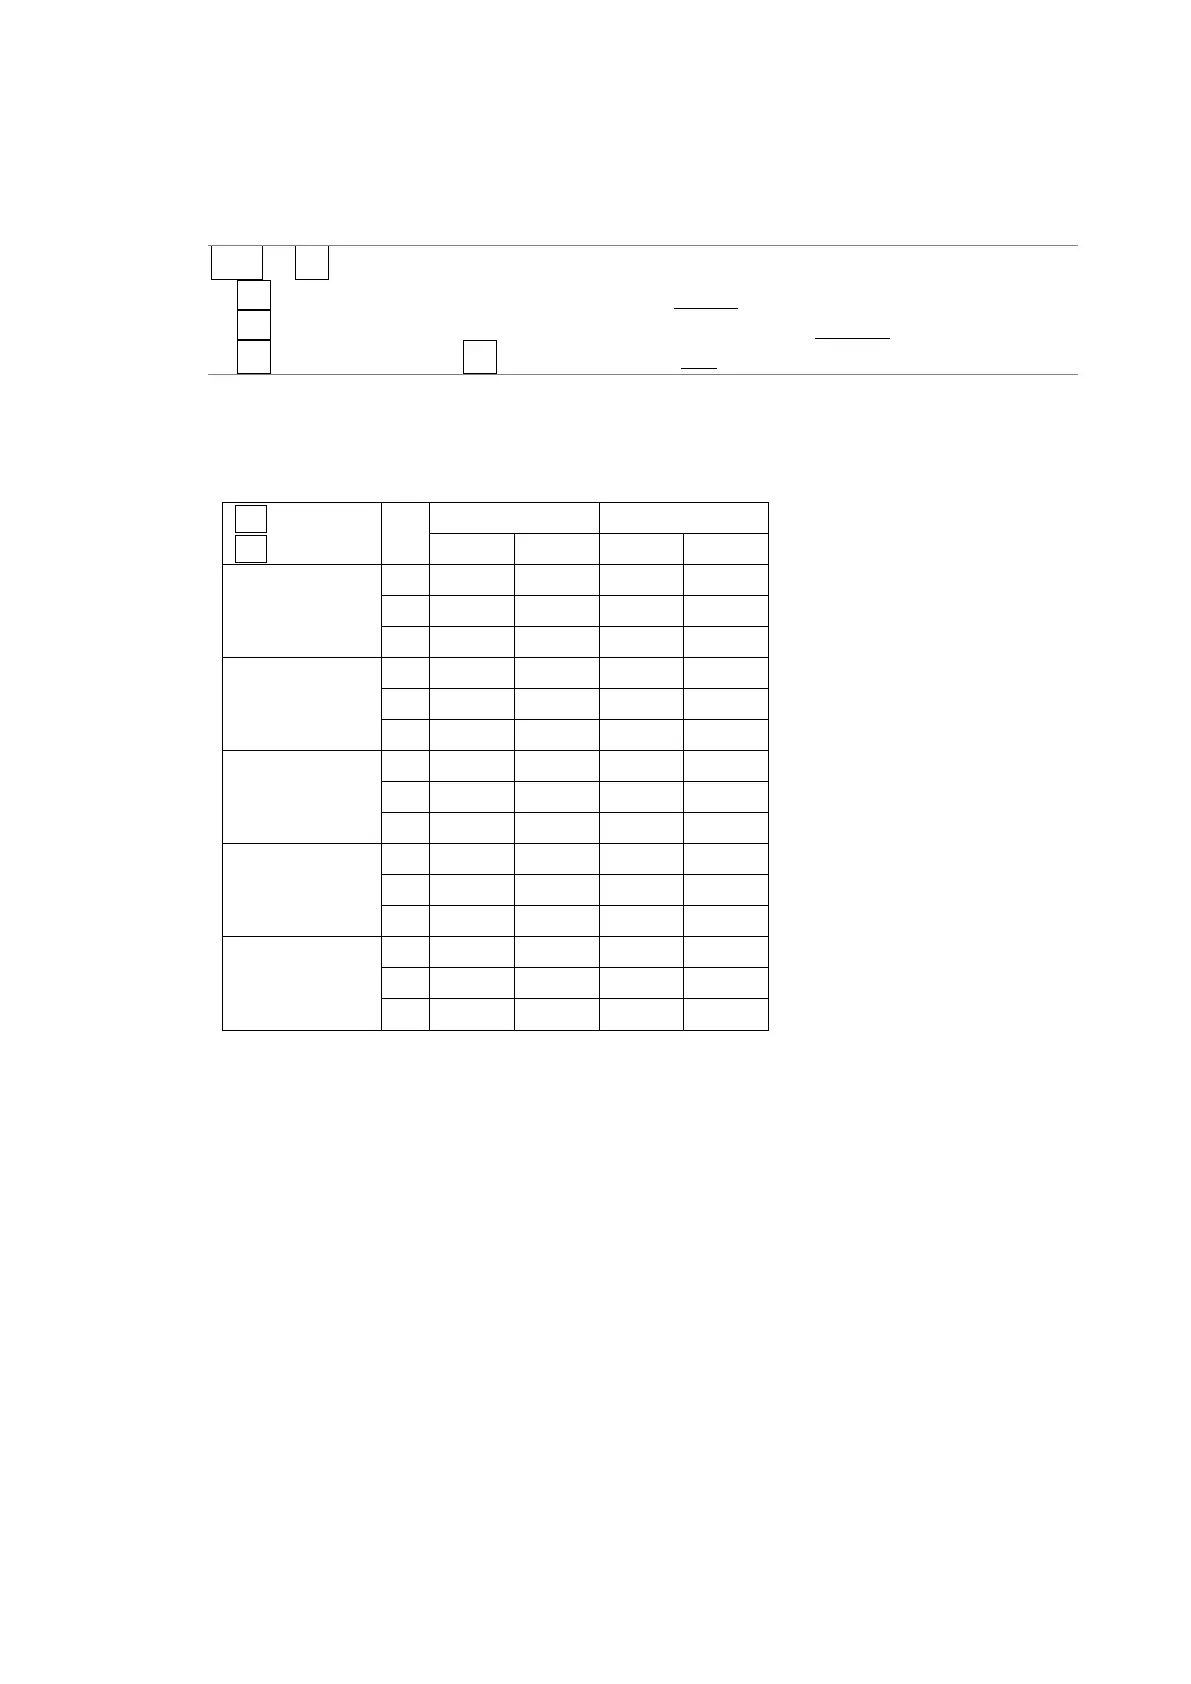
The color triangle vertex coordinates are shown below.
u’v’ coordinates are calculated from the xy coordinates.
Table 12-1 Color triangle vertex coordinates