09/03
4-180
DC 3535/2240/1632, WC M24
ADJ 9.14
Initial issue
Repairs and Adjustments
ADJ 9.14 Inboard/Outboard Density
Purpose
CAUTION
Perform this adjustment only to correct a customer complaint. Altering settings to correct for a
specific condition may have unintended effects in other situations. Make as small a correction
as possible to satisfy the complaint.
To perform the ROS In/Out light quantity correction with this adjustment, when IN/Out densities
are different but the parameters other than ROS light quantity judges that all is normal.
Adjustment
1. Load 8.5 x 11” or A4 (LEF) paper into Tray 1.
2. Enter dC612.
3. Select the Test Pattern as follows:.
• Pattern: 2 (IOT Halftone)
• Cin (%): 30 or 40%; whichever shows the greatest density variation
• Print Count: 1
•Tray: Tray 1
• Paper Type: Normal
• Resolution: None
• Paper: Simplex
• Color Mode: You will print one or more test patterns of each color (C, Y, M, and K)
4. Select B/W and print out the test pattern. Analyze the density variation as follows:
NOTE: The terms Inboard and Outboard refer to the orientation of the sheet as fed into the
facedown tray. When the sheet is flipped over and rotated so that the lead edge is at the
top, Outboard will be to the left and Inboard will be to the right.
• Divide the print into four zones from outboard to inboard
• Determine the relative density between the four zones. Qualify the density on a 1-to-
five scale with 5 being good density, and 1 being “very light” density. This is a relative
comparison - you are comparing one area of the page to another, not to a standard
density
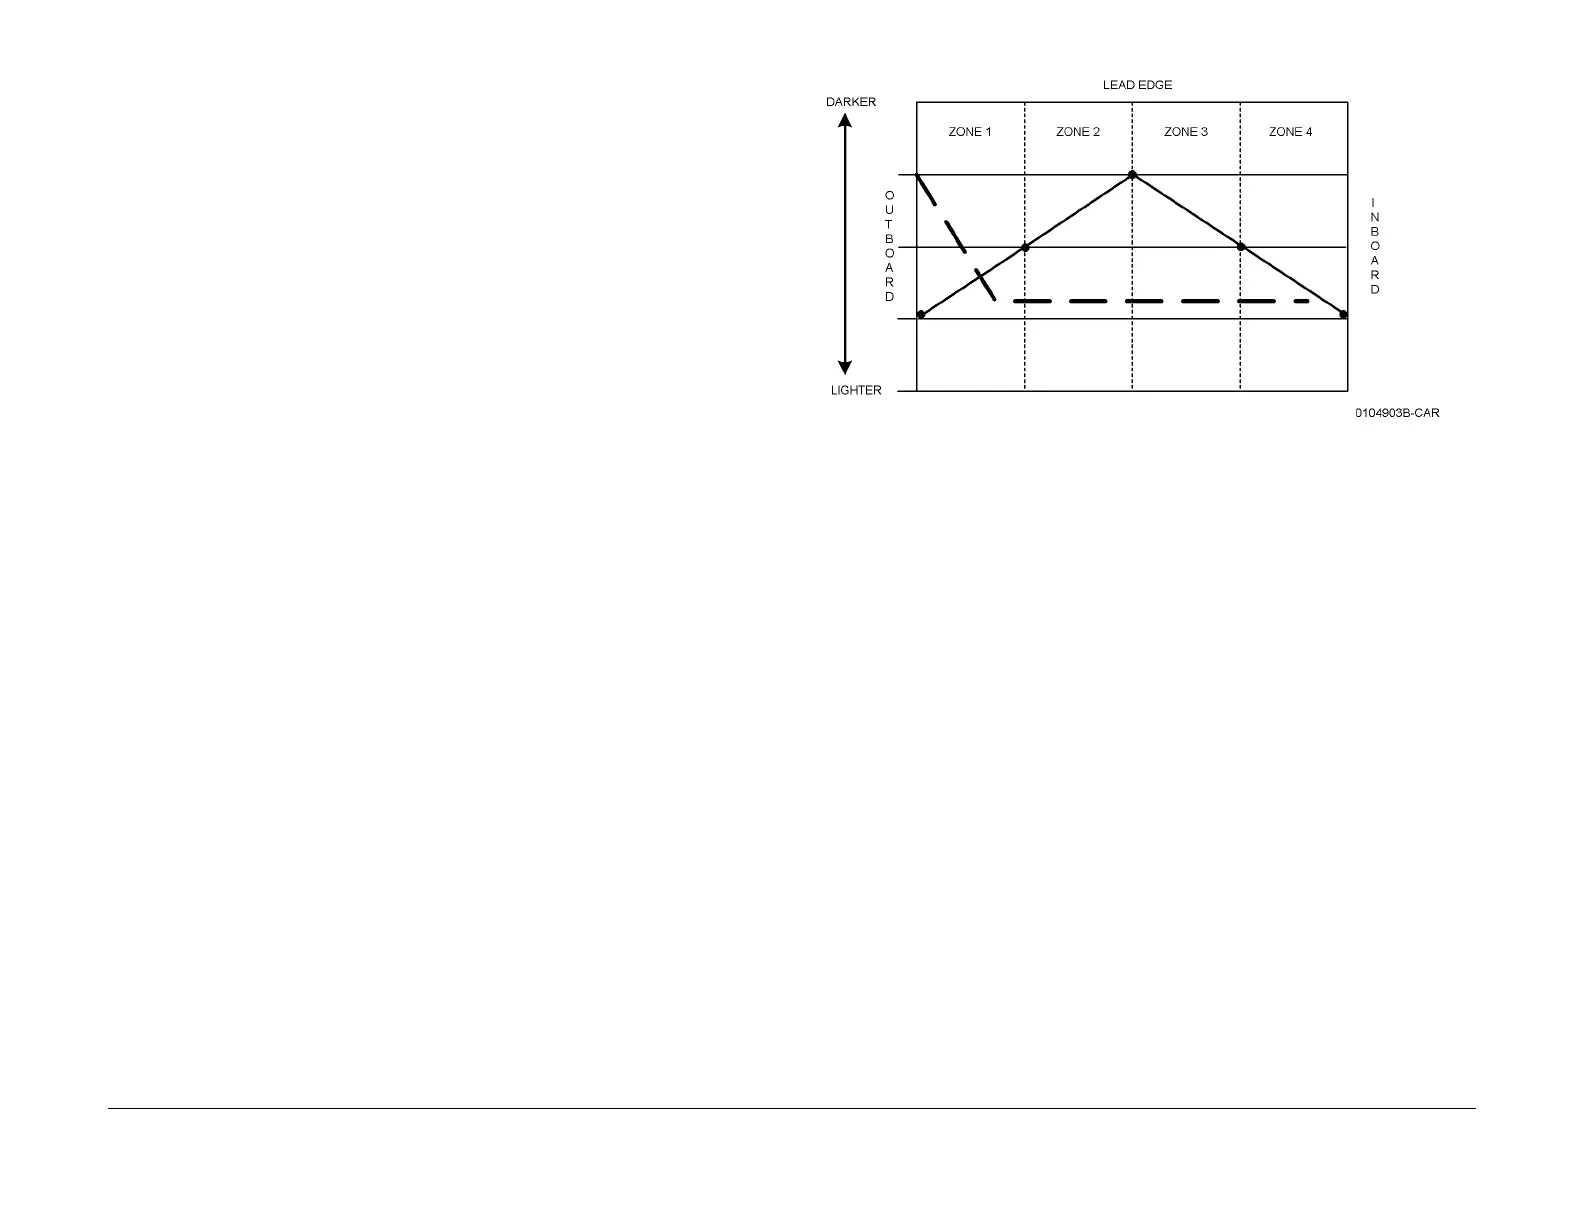
• Refer to Figure 1. This example shows two different conditions. The solid line repre-
sents the condition where the density is light on both inboard and outboard edges,
and darker in the center. The dotted line indicates a non-linear condition wherein the
density is darker at the outboard edge, and is light for the rest of the sheet.
Figure 1 Density Pattern Example
• Compare the results of the printed test pattern with the 19 patterns in Figures 2~20.
Pick the pattern that most closely represents the printed pattern.
– For conditions where the density is darker on the inboard edge and becomes
progressively lighter towards the outboard edge, choose between Figure 2, Fig-
ure 3, Figure 4, or Figure 5.
– For conditions where the density is darker on the outboard edge and becomes
progressively lighter towards the inboard edge, choose between Figure 6, Fig-
ure 7, Figure 8, or Figure 9.
– For conditions where the density is darker in the center and becomes progres-
sively darker towards both edges, choose between Figure 14, Figure 15, Figure
16, or Figure 17.
– For conditions where the density is light in the center and becomes progres-
sively darker towards both edges, choose between Figure 18, Figure 19, or Fig-
ure 20.
– For non-linear density variations choose between Figure 10, Figure 11, Figure
12, or Figure 13.
CAUTION
Use only the values listed in the tables. Do not try to interpolate values!
NOTE: Use this routine with caution. The routine works by lowering the density of the area
determined to be darker; it cannot darken light areas. It is possible to get the density even, but
objectionably light.
5. Change the values in the appropriate NVM locations to the values listed for that pattern.
6. Print the test pattern again and confirm the change. Repeat as necessary until the density
is even from inboard to outboard.
7. Repeat Steps 3~6 for Cyan, Magenta, then Yellow.
8. Verify the solution using the images that caused the customer complaint.
 Loading...