GUI reference
R&S
®
ZNB/ZNBT
322User Manual 1173.9163.02 ─ 62
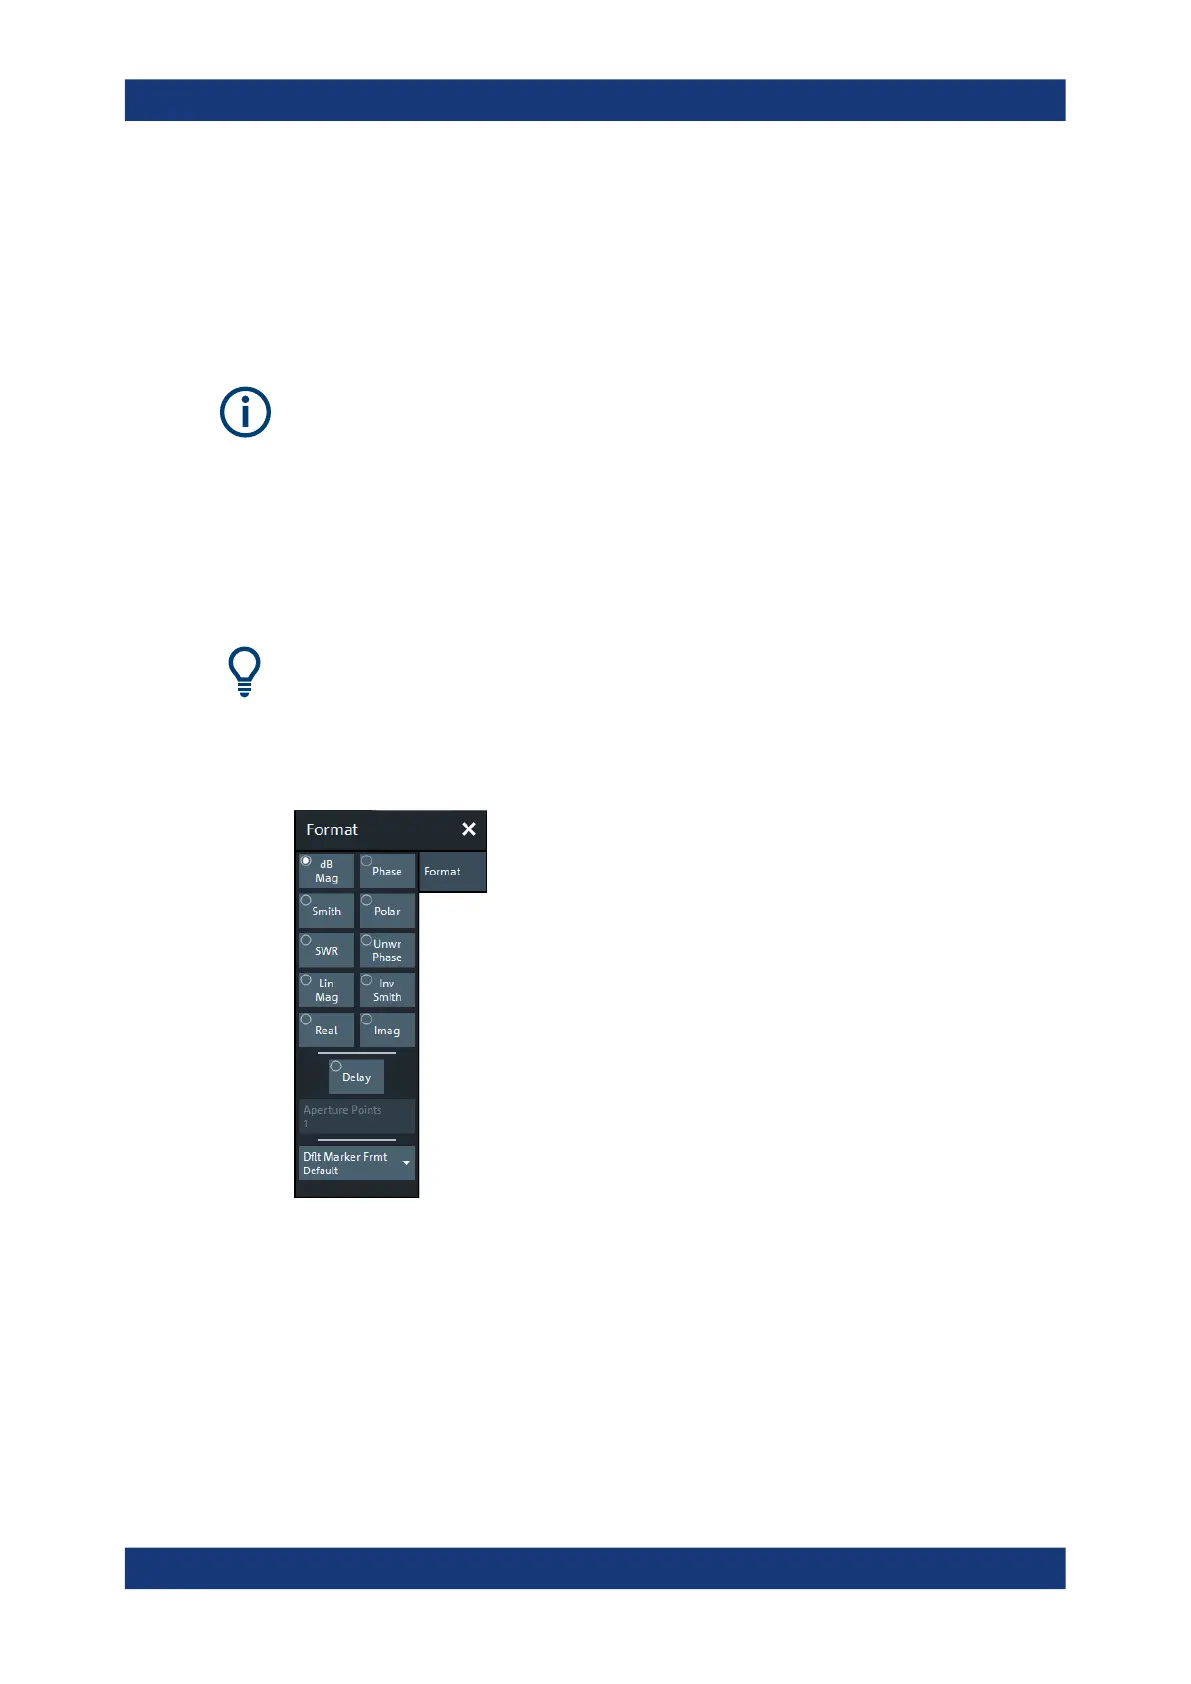
5.3 Format softtool
The "Format" softtool allows you to define how the measured data is presented in the
diagram area.
Access: Trace – [Format]
Measured quantities and display formats
The analyzer allows arbitrary combinations of display formats and measured quantities
(see Chapter 5.2, "Meas softtool", on page 284). Nevertheless, to extract useful infor-
mation from the data, it is important to select a display format which is appropriate to
the analysis of a particular measured quantity.
An extended range of formats is available for markers. To convert any point on a trace,
create a marker and select the appropriate marker format (see "Marker Format"
on page 394). Marker and trace formats can be applied independently.
Background information
Refer to the following sections:
●
Chapter 4.2.3, "Trace formats", on page 117
●
Chapter 4.2.3.3, "Measured quantities and trace formats", on page 124
dB Mag
Selects a Cartesian diagram with a dB scale of the vertical axis to display the magni-
tude of the complex measured quantity.
Properties: The stimulus variable appears on the horizontal axis, scaled linearly. The
magnitude of the complex quantity C, i.e. |C| = sqrt ( Re(C)
2
+ Im(C)
2
), appears on the
vertical axis, scaled in dB. The decibel conversion is calculated according to dB
Mag(C) = 20 * log(|C|) dB.
Format softtool

 Loading...


