GUI reference
R&S
®
ZNB/ZNBT
418User Manual 1173.9163.02 ─ 62
5.8.3 Time Domain X-Axis tab
If the active trace is a time domain trace, these settings define its stimulus axis.
Time domain analysis requires option R&S ZNB-K2 / R&S ZNBT-K2. If this option is
not installed, the "Time Domain X-Axis" tab is hidden.
Related information
Refer to the following sections:
●
Chapter 4.7.2, "Time domain analysis", on page 222
●
Chapter 5.5.5, "Time Domain tab", on page 348
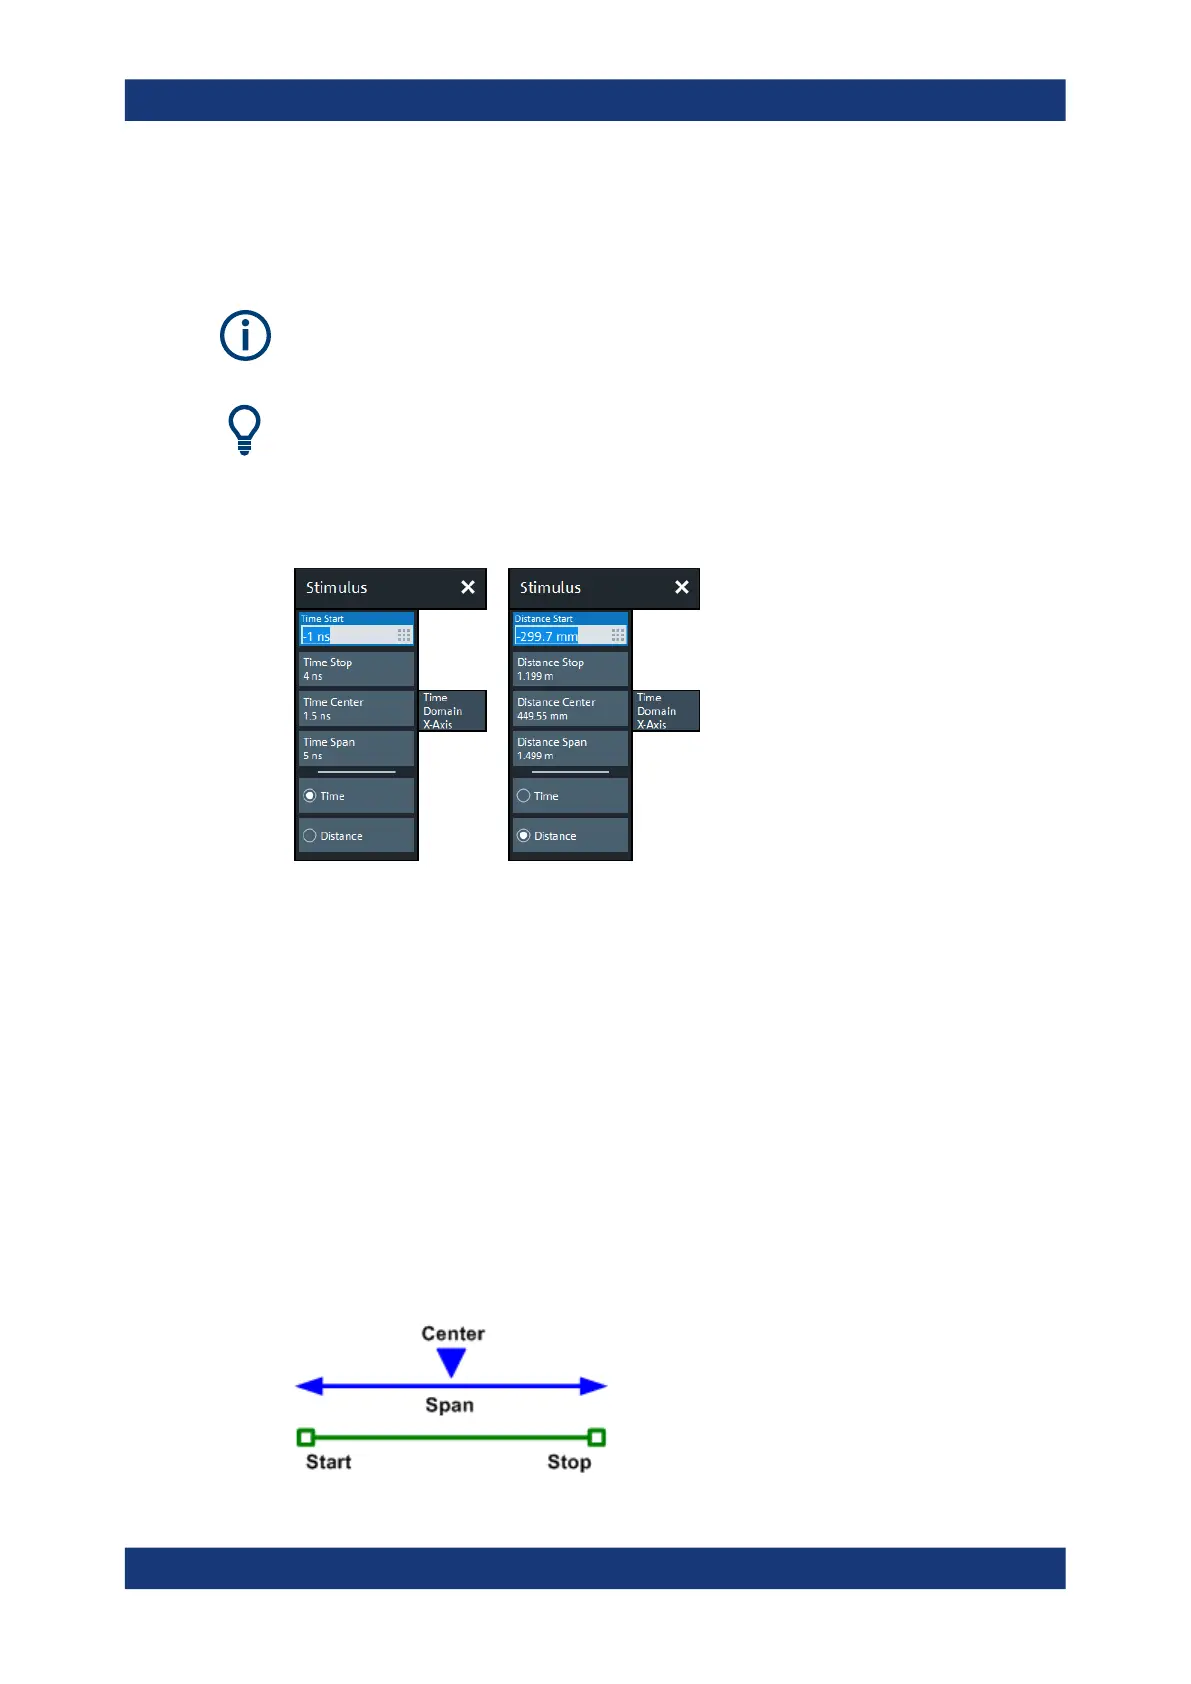
Figure 5-8: Stimulus > Time Domain X-Axis softtool tab
left = Time representation
right = Distance representation
Time Start / Time Stop / Time Center / Time Span
Defines the display range for the time domain trace in time representation (see " Time /
Distance" on page 419).
●
"Time Start" is the lowest displayed time and corresponds to the left edge of the
Cartesian diagram.
●
"Time Stop" is the highest displayed time and corresponds to the right edge of the
Cartesian diagram.
●
"Time Center" corresponds to the center of the Cartesian diagram, i.e. ("Time Start"
+ "Time Stop")/2.
●
"Time Span" corresponds to the diagram width, i.e. ("Time Stop" – "Time Start").
"Time Start" and "Time Stop" or "Time Center" and "Time Span" are alternative set-
tings.
Stimulus softtool
 Loading...