GUI reference
R&S
®
ZNB/ZNBT
414User Manual 1173.9163.02 ─ 62
●
While in Cartesian diagrams the x-axis represents the stimulus values, in polar and
Smith diagrams this direct relation is lost. In any case, a marker can be used to dis-
play the stimulus value of a given trace point.
For "Time Domain" traces, points in the "observation interval" are interpreted as
stimulus values.
●
All stimulus settings except the "Time Domain X-Axis" settings are channel set-
tings. "Time Domain X-Axis" applies to the active (time domain) trace only.
Background information
Refer to the following sections:
●
Chapter 4.1.3, "Traces, channels and diagrams", on page 88
●
Chapter 3.3.7.2, "Setting the sweep range", on page 74
●
Chapter 3.3.7.6, "Set by marker", on page 76
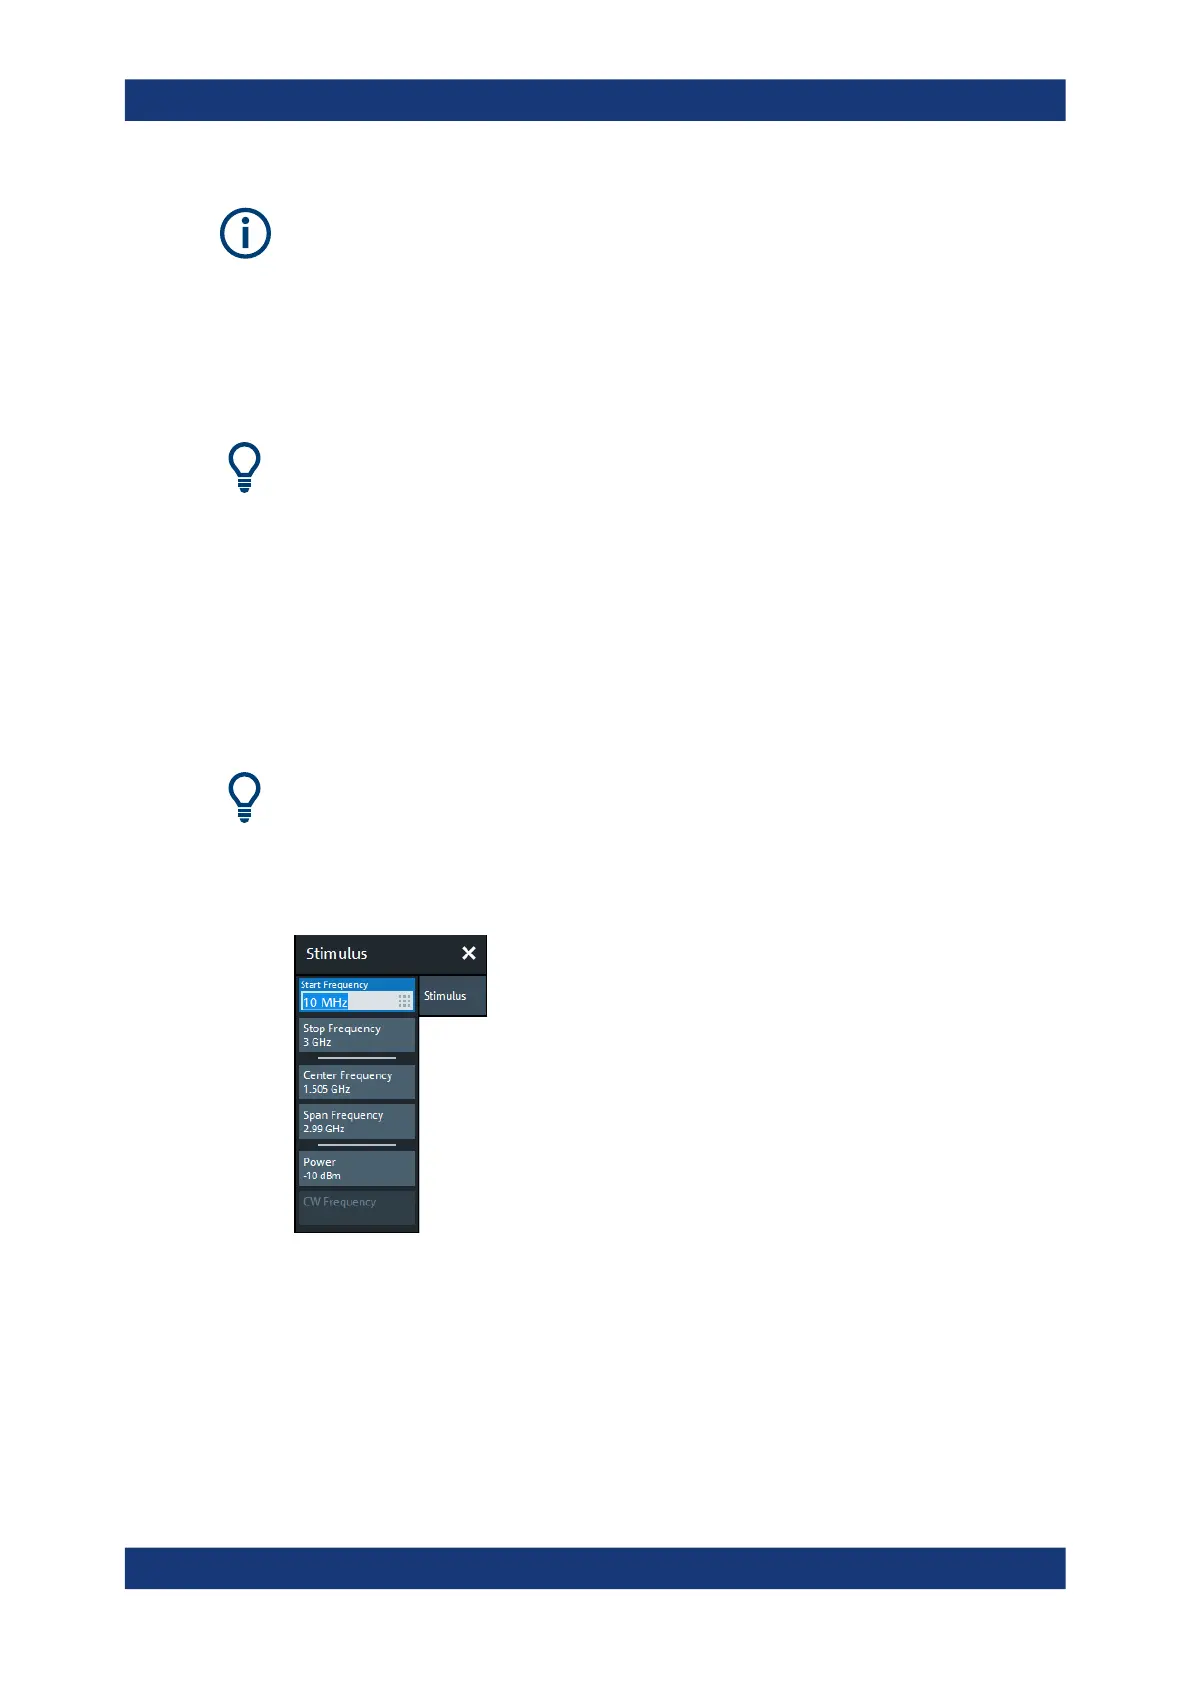
5.8.1 Stimulus tab
Defines the sweep range in the current channel, depending on the sweep type.
Related Settings
Refer to the following sections:
●
Chapter 4.1.4.4, "Stimulus and sweep types", on page 96
●
Chapter 5.10.2, "Sweep Type tab", on page 426
The following "Stimulus" settings are also available on the "Power" tab:
●
Power
●
Start Power / Stop Power
Start Frequency / Stop Frequency / Center Frequency / Span Frequency
Defines the sweep range for non-segmented frequency sweeps.
For a Lin Freq sweep, setting "Start Frequency" and "Stop Frequency" or "Center Fre-
quency" and "Span Frequency" are alternatives.
Stimulus softtool

 Loading...


