Concepts and features
R&S
®
ZNB/ZNBT
88User Manual 1173.9163.02 ─ 62
●
Cal pool data including system error correction and power correction data
●
Directories for trace data, limit lines, calibration data etc.
●
Color schemes and printer settings
●
System configurations, to be accessed via System – [Setup].
●
External power meter, generator and switch matrix configurations
Global settings are not part of a recall set nor are they affected by a [Preset] of the
analyzer. Many of them can be "Reset" in the "System Config" dialog.
Some settings are session-specific, i.e. they are initialized to default when a new mea-
surement session is started (session settings).
4.1.2 Recall sets
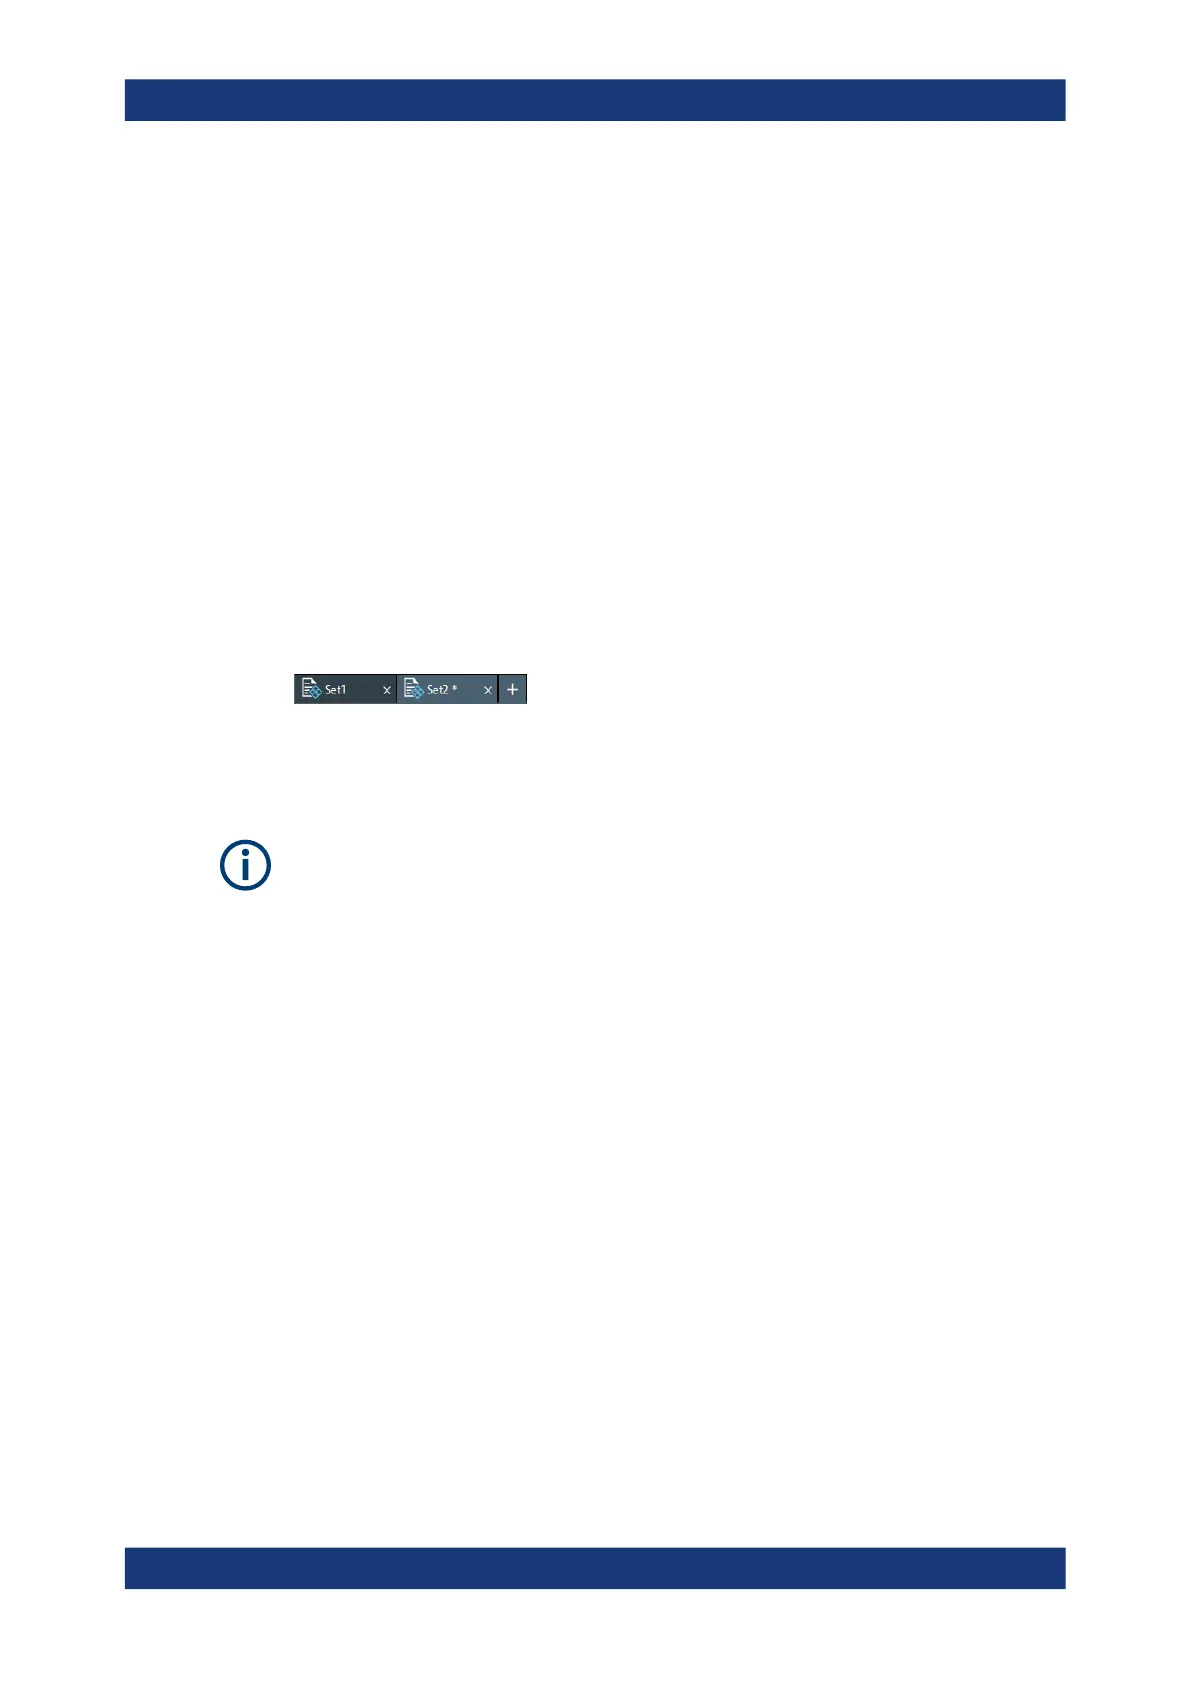
A recall set comprises a set of diagrams together with the underlying system, channel,
trace and display settings. The R&S ZNB/ZNBT can handle multiple recall sets in par-
allel, each of them displayed in a separate tab.
A recall set can be saved to a recall set file (*.znx|*.znxml) and reopened at a later
point in time or at another instrument. Use the "Recall Sets" tab of the System – [File]
softtool to organize recall sets.
A recall set only contains setup instructions, i.e. information on how to measure, how to
process the measurement results, and how to display the processed results. It does
not contain any trace or result data.
4.1.3 Traces, channels and diagrams
The analyzer arranges, displays or stores the measured data in traces which are
assigned to channels and displayed in diagrams. To understand the functions of the
instrument and quickly find the appropriate settings, it is important to understand the
exact meaning of the three terms.
●
A trace is a set of data points that can be displayed together in a diagram. The
trace settings specify the mathematical operations used to obtain traces from the
measured or stored data and to display them.
●
A channel contains hardware-related settings which specify how the network ana-
lyzer collects data.
●
A diagram is a rectangular portion of the screen which is used to display traces.
Diagrams belonging to the same recall set are arranged in a common tab. The set-
tings for diagrams are described in Chapter 4.2.1, "Display elements of a diagram",
on page 102.
A diagram can contain a practically unlimited number of traces, assigned to different
channels. Diagrams and channels are independent from each other.
Basic concepts

 Loading...


