GUI reference
R&S
®
ZNB/ZNBT
355User Manual 1173.9163.02 ─ 62
5.5.7 Distance to Fault tab
This tab is only visible, if option K3 is installed on the R&S ZNB/ZNBT. It replicates the
"Distance to Fault" tab of the "Distance to Fault" application. See Chapter 5.16.4, "Dis-
tance to Fault Application", on page 727.
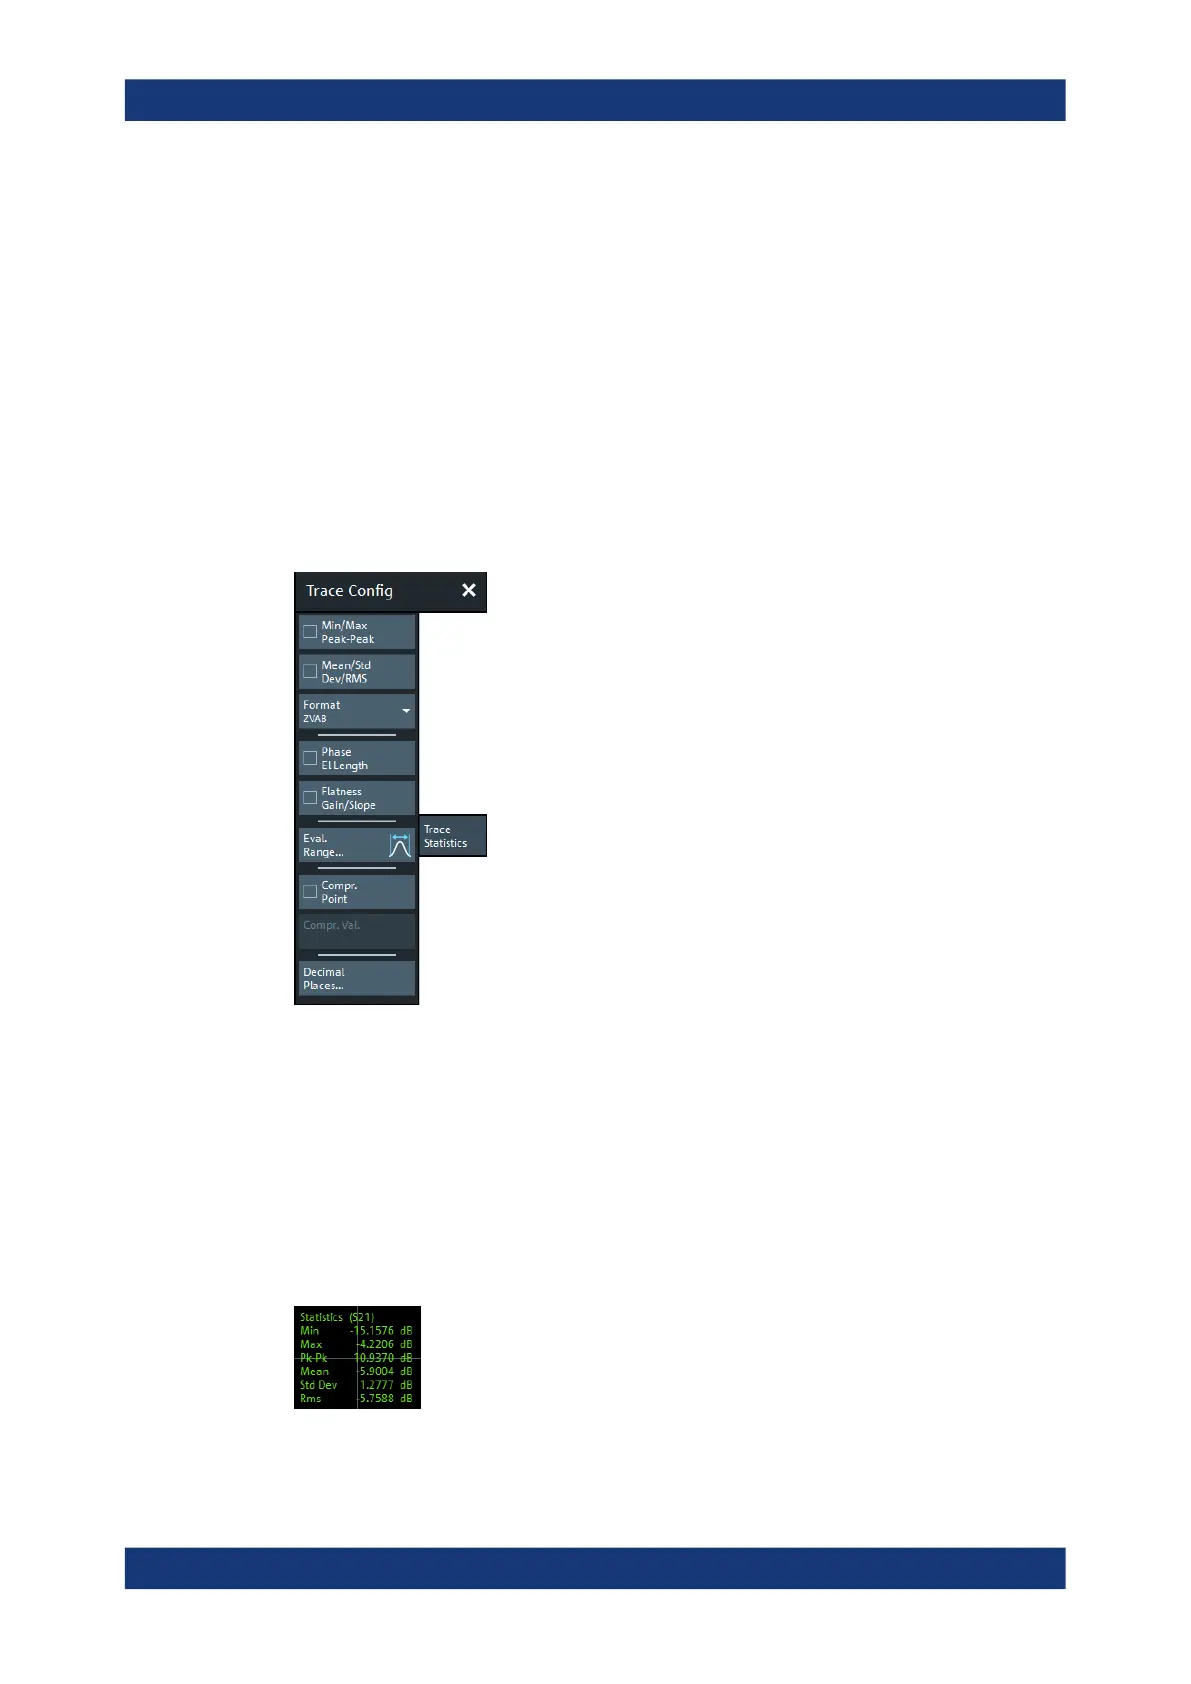
5.5.8 Trace Statistics tab
Evaluates statistical and phase information of the entire trace or of a specific evalua-
tion range and calculates the x-dB compression point.
5.5.8.1 Controls on the Trace Statistics tab
The "Evaluation Range..." button opens the "Evaluation Range" dialog (see Chap-
ter 5.5.8.2, "Evaluation Range dialog", on page 360).
The "Decimal Places..." button opens the "System Config" dialog to define the (maxi-
mum) number of fractional digits for setting values and measurement results. See also
"User Interface tab" on page 755..
Min/Max/Peak-Peak, Mean/Std Dev/RMS
The upper two softkeys in the "Trace Statistics" tab display or hide groups of statistical
results. The values are based on all response values of the trace in the selected evalu-
ation range ("Evaluation Range...").
Trace Config softtool

 Loading...


