Getting started
R&S
®
ZNB/ZNBT
66User Manual 1173.9163.02 ─ 62
3.3.5 Handling diagrams, traces, and markers
The analyzer displays measurement results as traces in rectangular diagrams. Markers
are used to read specific numerical values and to search for points or regions on a
trace. The following section presents some of the graphical tools the R&S ZNB/ZNBT
provides for trace and marker handling.
For further reference
Refer to Chapter 4, "Concepts and features", on page 87 to learn more about traces,
channels, and screen elements.
3.3.5.1 Adding new traces and diagrams
A new trace is required if you want to measure and display an additional quantity.
Typical scenario: The transmission coefficient S
21
is measured as described in Chap-
ter 3.4.1, "Transmission S-parameter measurement", on page 78. A trace is added to
display the reflection coefficient S
11
for comparison.
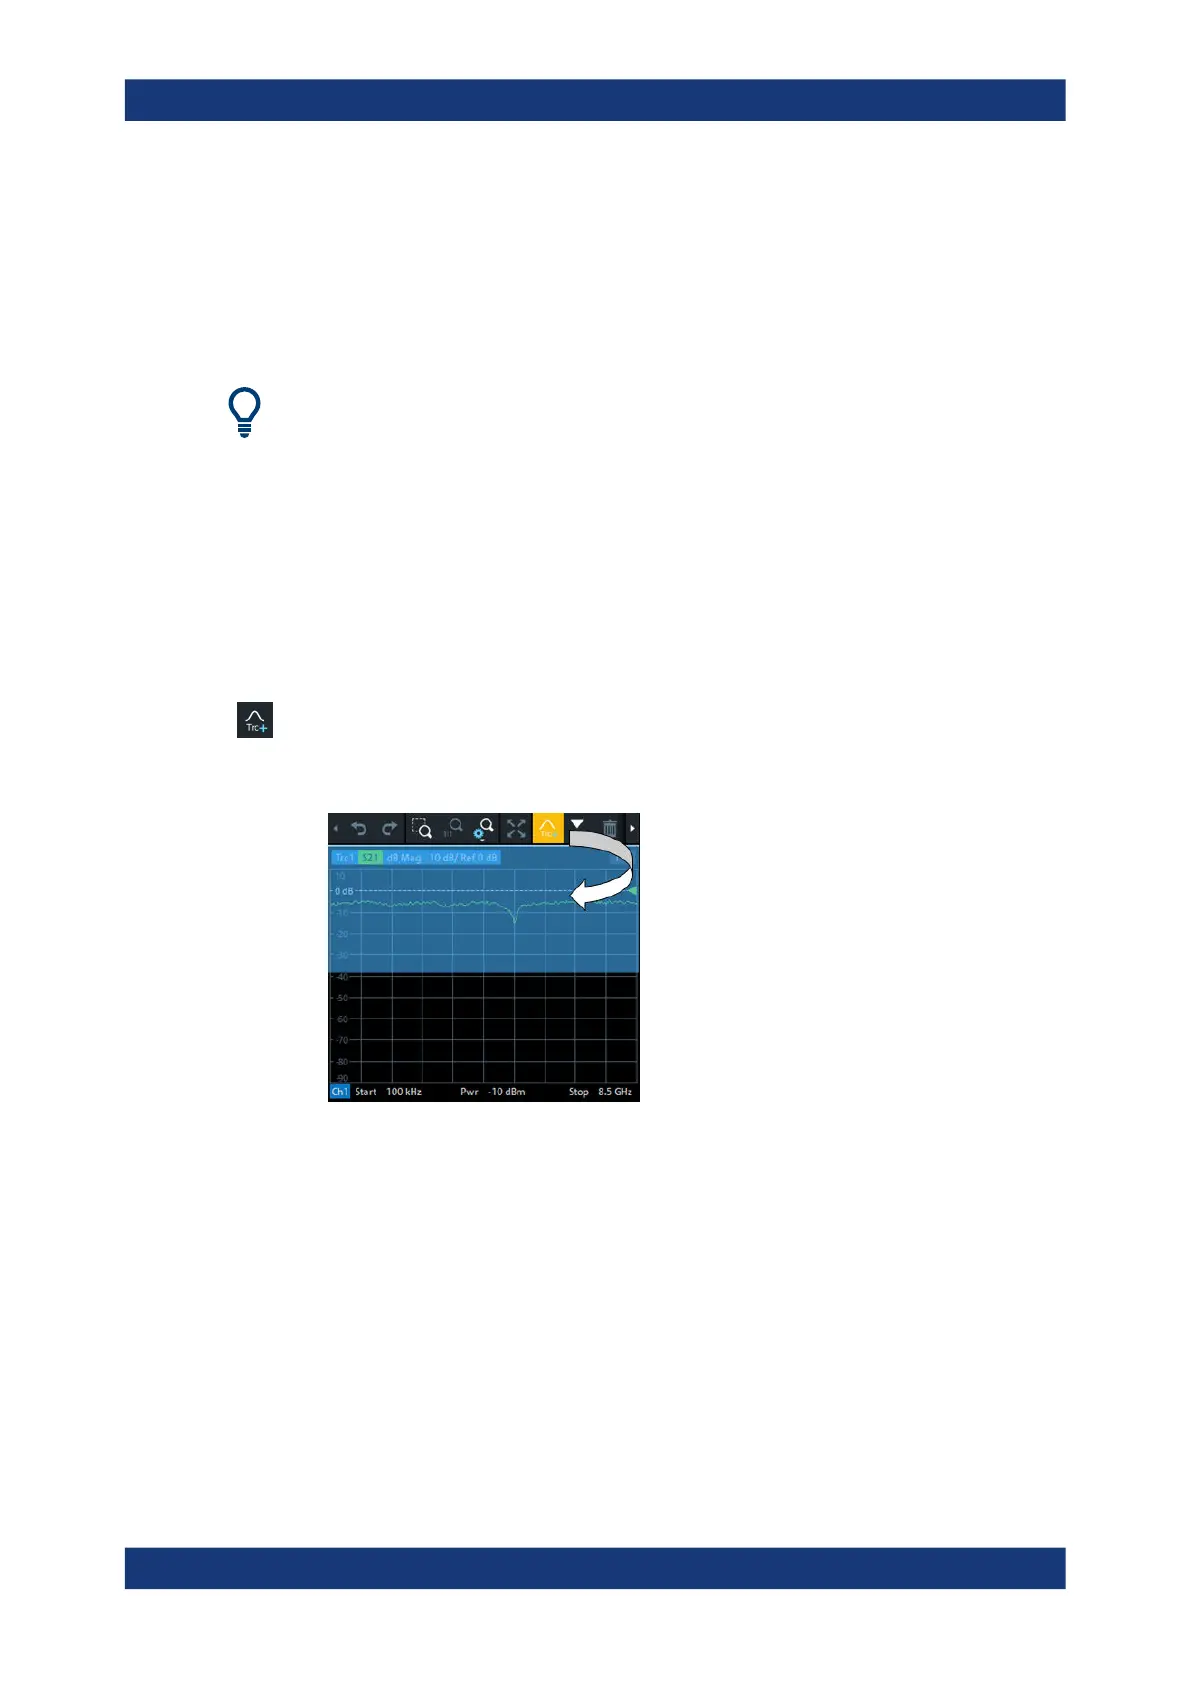
To create a trace:
1. Drag the "Trc+" icon from the toolbar into a diagram.
The diagram changes its color scheme and contents as shown below.
2. Select the adequate drop position, depending on whether you want to display the
new trace in the existing diagram, or whether you want to add a new diagram. The
highlighted area indicates the target diagram.
Operating the instrument

 Loading...


