GUI reference
R&S
®
ZNB/ZNBT
503User Manual 1173.9163.02 ─ 62
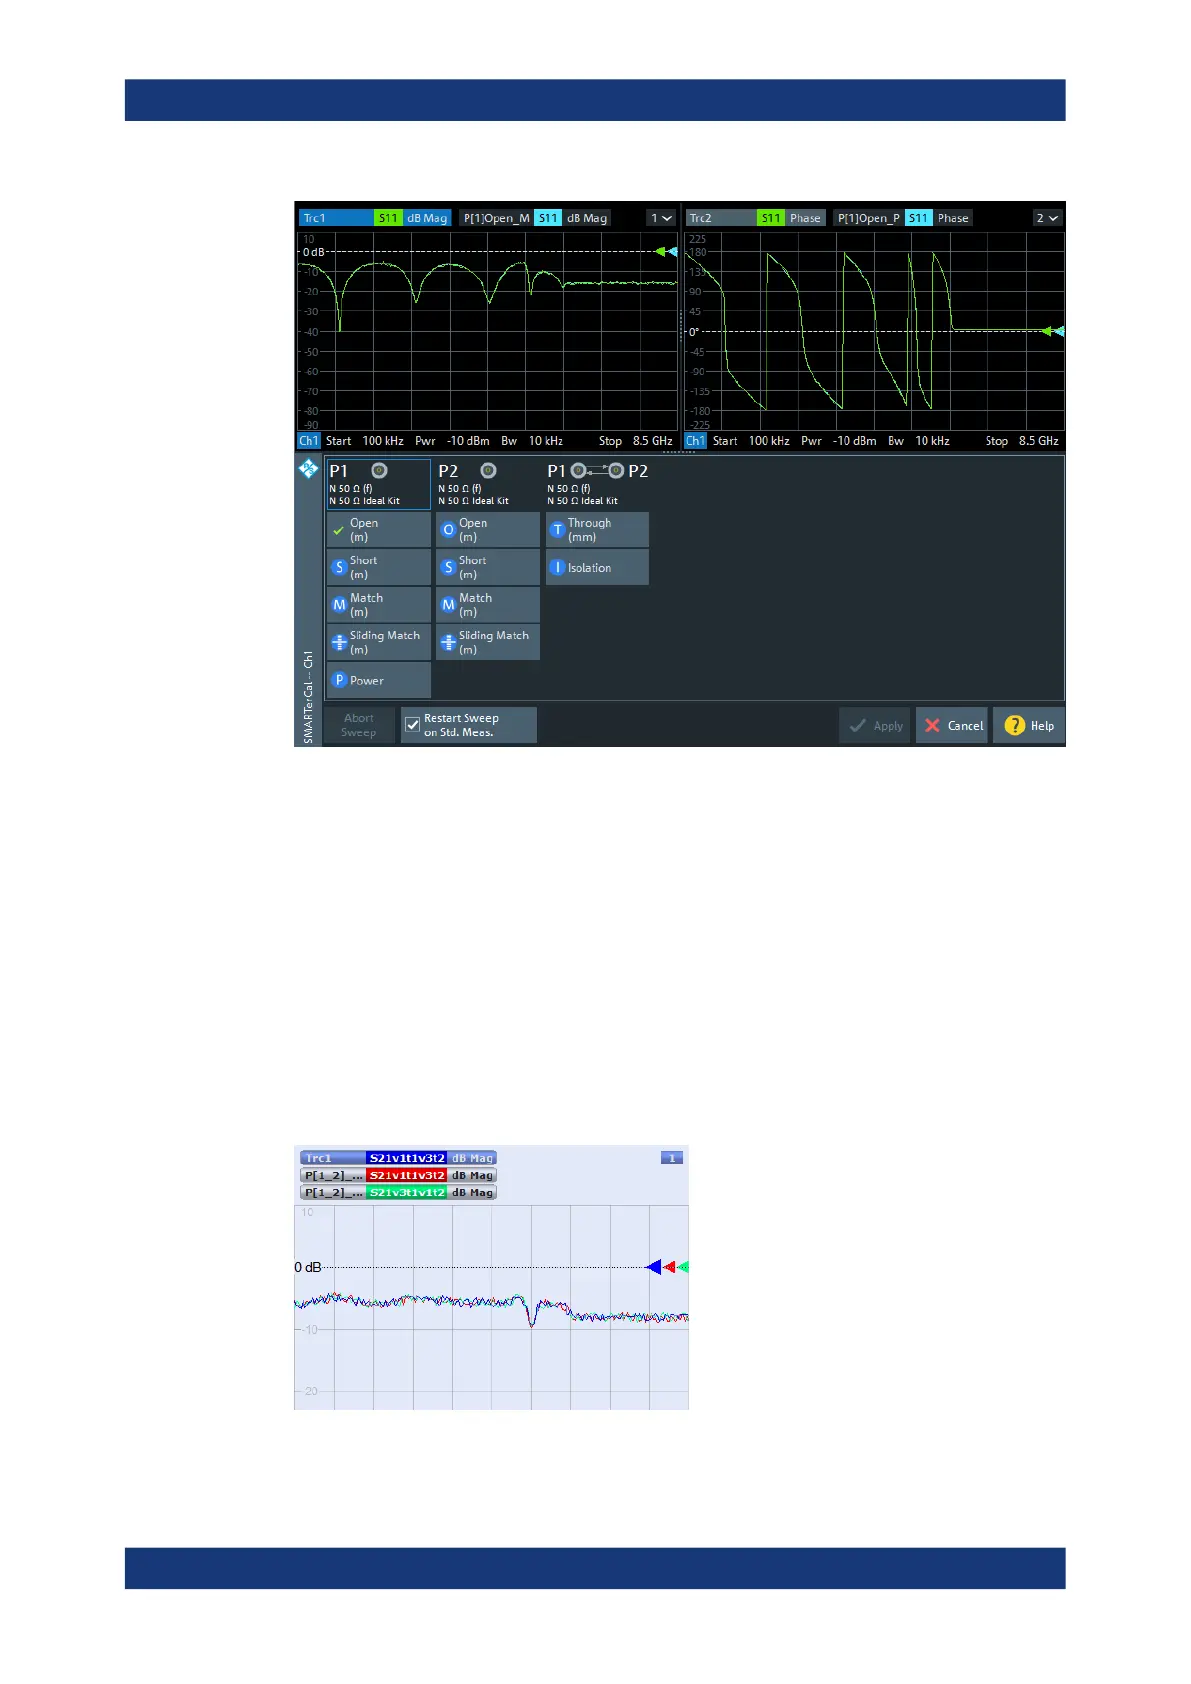
The upper part of the calibration screen presents
●
calibration sweep diagrams for the currently measured S-parameter during stand-
ards measurement,
●
power trace diagrams during the power calibration sweep
The lower part displays the calibrated port (pairs) with their related measurements and
visualizes the measurement progress.
Calibration Sweep Diagrams
During the calibration sweep, each diagram contains a single S-parameter trace and a
typical result trace for the measured calibration standard.
If switch matrices are involved, a sweep is performed for every possible signal path
and for each of these paths a separate S-parameter trace is shown (see Chap-
ter 4.7.29.5, "Multiple paths and calibration", on page 275).
Figure 5-39: Multiple traces due to multiple paths
Cal softtool

 Loading...


