4.3 Drawing Methods
4-42
Scale
Bar Graph Scale
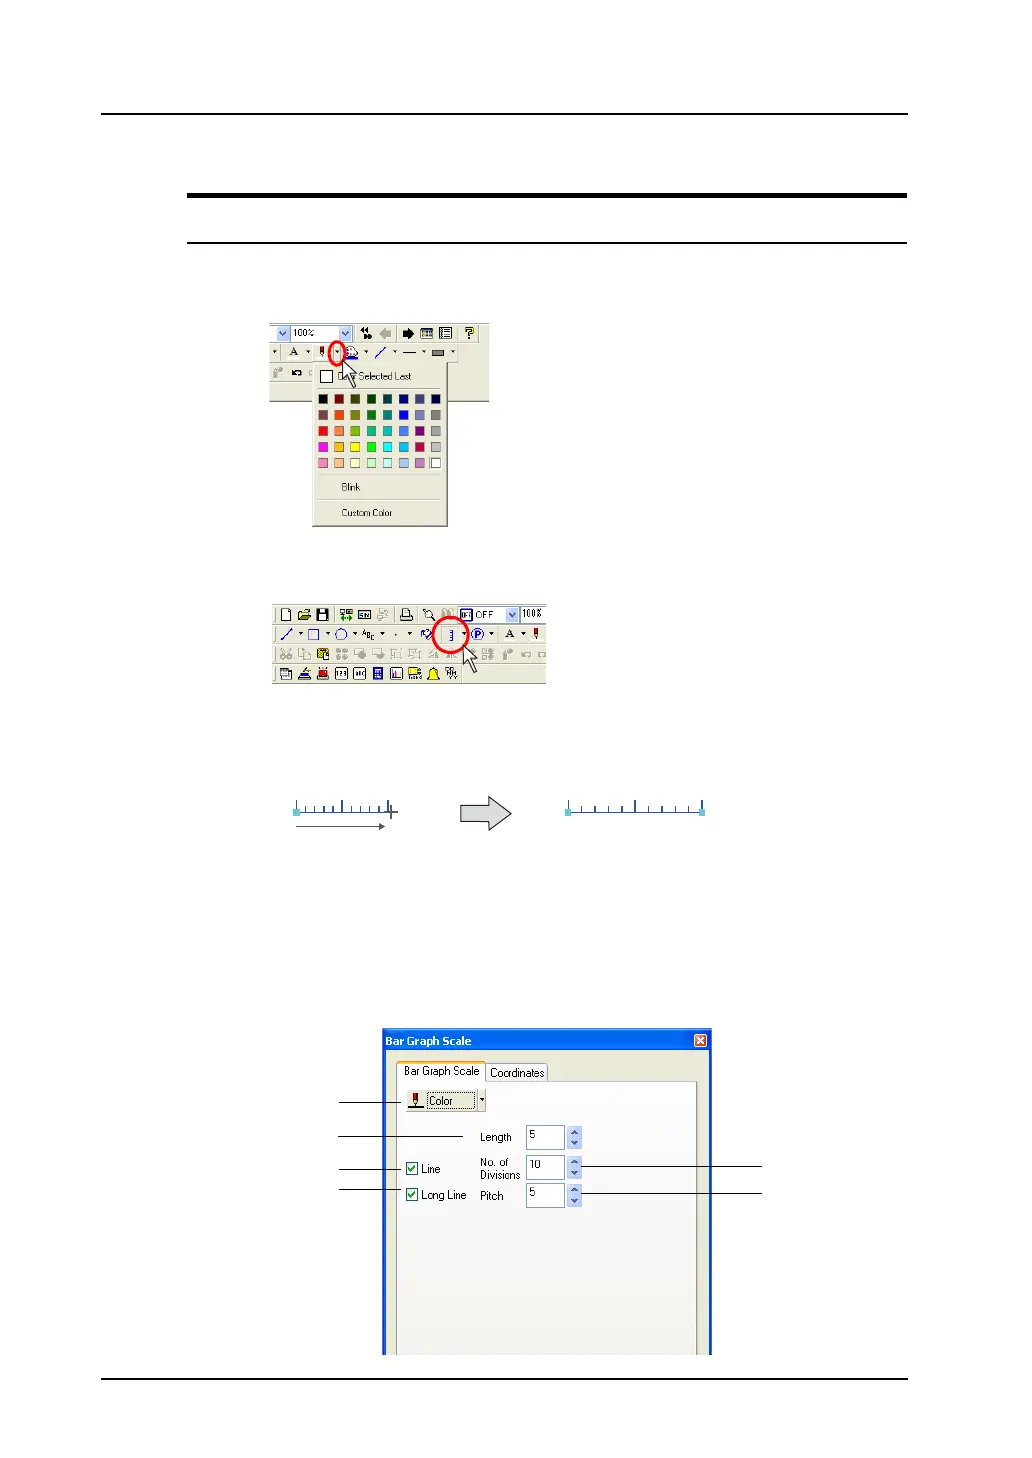
Drawing method
1. Select a line color from the [Line Color/Frame Color] icon on the toolbar.
2. Click the [Scale] icon on the toolbar.
The icon is depressed and the mouse cursor is turned into a cross-shaped cursor.
3. Drag the mouse from the start point to the end.
A scale is drawn in a color selected in step 1.
4. To reset the drawing setting, right-click or double-click the mouse button. By dragging the mouse
again without resetting it, you can draw another scale continuously.
[Bar Graph Scale] dialog
Clicking (or double-clicking) the bar graph scale brings up the [Bar Graph Scale] dialog shown below.
Drag.
3
5
4
6
1
2