4.3 Drawing Methods
4-46
Trend Graph Scale
Drawing method
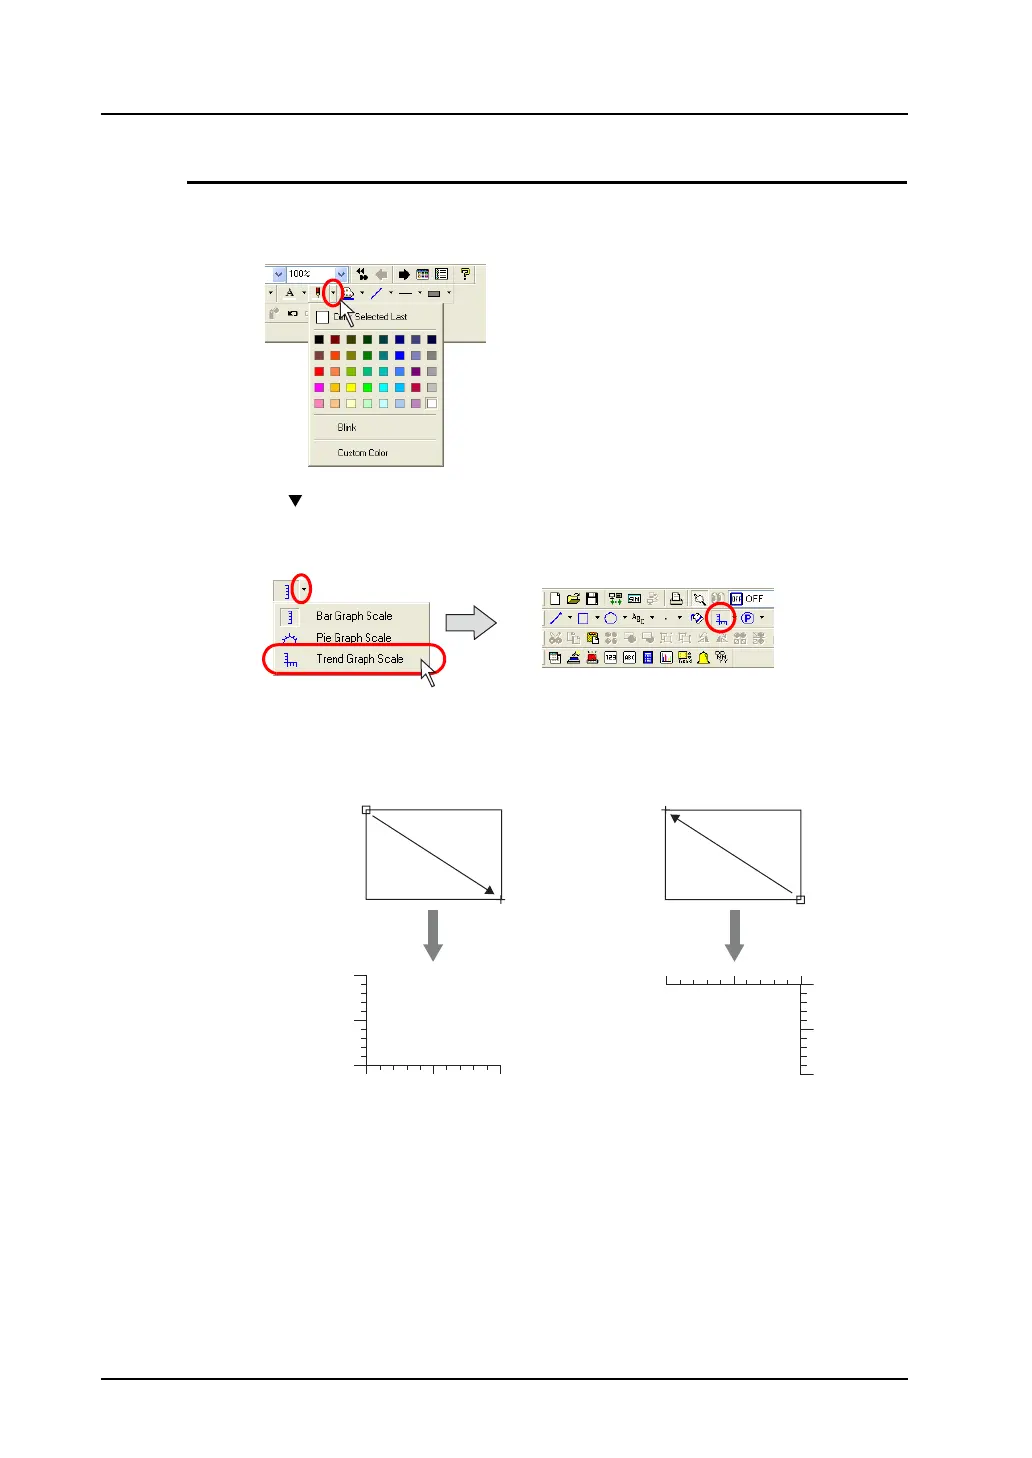
1. Select a line color from the [Pen Color] icon on the toolbar.
1. Click the “ ” mark on the right of the [Scale] icon on the toolbar.
Select [Trend Graph Scale] from the scale type displayed.
The icon is depressed and the mouse cursor is turned into a cross-shaped cursor.
2. Drag the mouse from the start point to the end point in the same way as drawing a rectangle. The
trend graph scale is drawn.
3. To reset the drawing setting, right-click or double-click the mouse button. By dragging the mouse
again without resetting it, you can draw another scale continuously.
Start point End point
End point
Start point
Drag. Drag.