4.3 Drawing Methods
4-45
4
Drawing
7. Clicking the mouse draws the pie graph scale.
8. To reset the drawing setting, right-click or double-click the mouse button. By dragging the mouse
again without resetting it, you can draw another scale continuously.
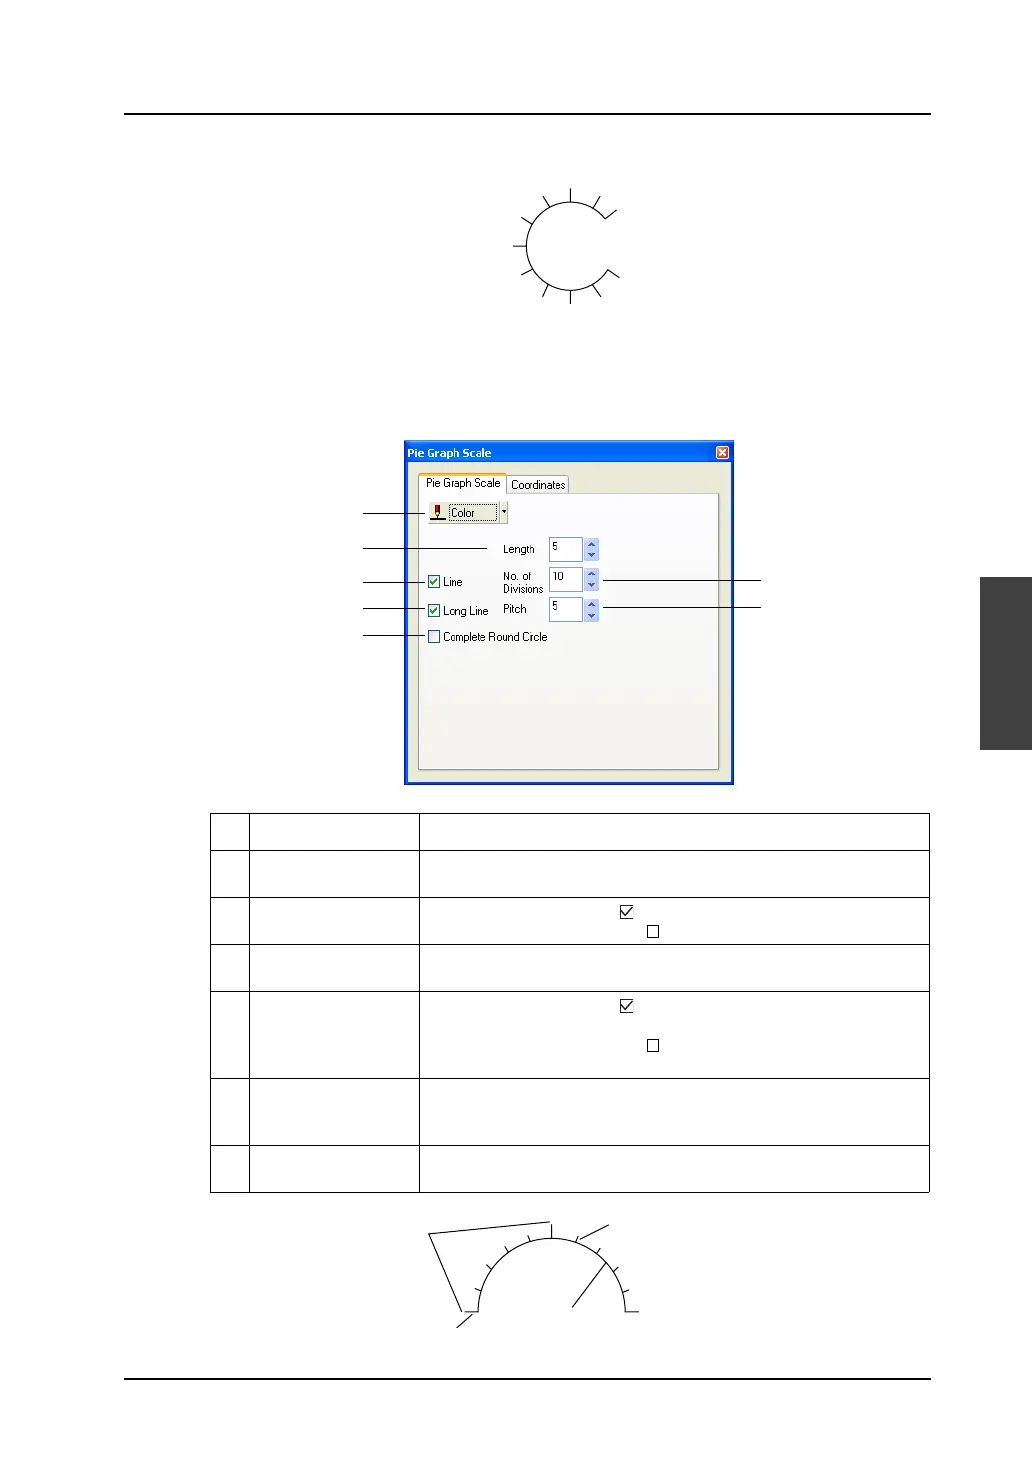
[Pie Graph Scale] dialog
Clicking (or double-clicking) the pie graph scale brings up the [Pie Graph Scale] dialog shown below.
1 Color Choose a color for the pie graph scale.
2 Length (1 - 16) Set the length of short gradation marks. Enter the numerical value in
the data field, or set the desired value using the Up/Down button.
3 Line When this box is checked ( ), the scale is drawn with lines.
When this box is not checked ( ), the scale is drawn without lines.
4 No. of Divisions
(1 - 255)
Set the number of divisions of the scale. Enter the numerical value in
the data field, or set the desired value using the Up/Down button.
5 Long Line When this box is checked ( ), long gradation marks are attached to
the scale at the specified pitch.
When this box is not checked ( ), long gradation marks are not
attached.
6 Pitch (1 - 16) This option is active when [Long Line] is checked.
Specify the pitch for long graduation marks. Enter the numerical value
in the data field, or set the desired value using the Up/Down button.
7 Complete Round
Circle
When this option is checked, the shape of the graph becomes circle,
not arc.
3
5
7
4
6
1
2
Pitch
Long gradation mark
Short gradation mark
Line