Instruction manual GLM-I Setting display and keyboard layout
38.019.129.001 en 95
8
8.9.2 Histogram display
The histogram display (also: horizontal bar graph) indicates the static distribution of
weights in form of nine bars. It is indicated in the display formats
<L1: Large diagr. display> and <L3: Small diagr. display>, see page 91.
The function <Statistics: histogram> is without function in combination
with the display and operating terminal GT
-12C.
It depends on the respective setting in GT-SoftControl if the histogram
display is indicated or not
.
The operation of GT-SoftControl is not subject of this documentation.
Read the operating instructions on GT-SoftControl.
8.9.3 Setting analog display
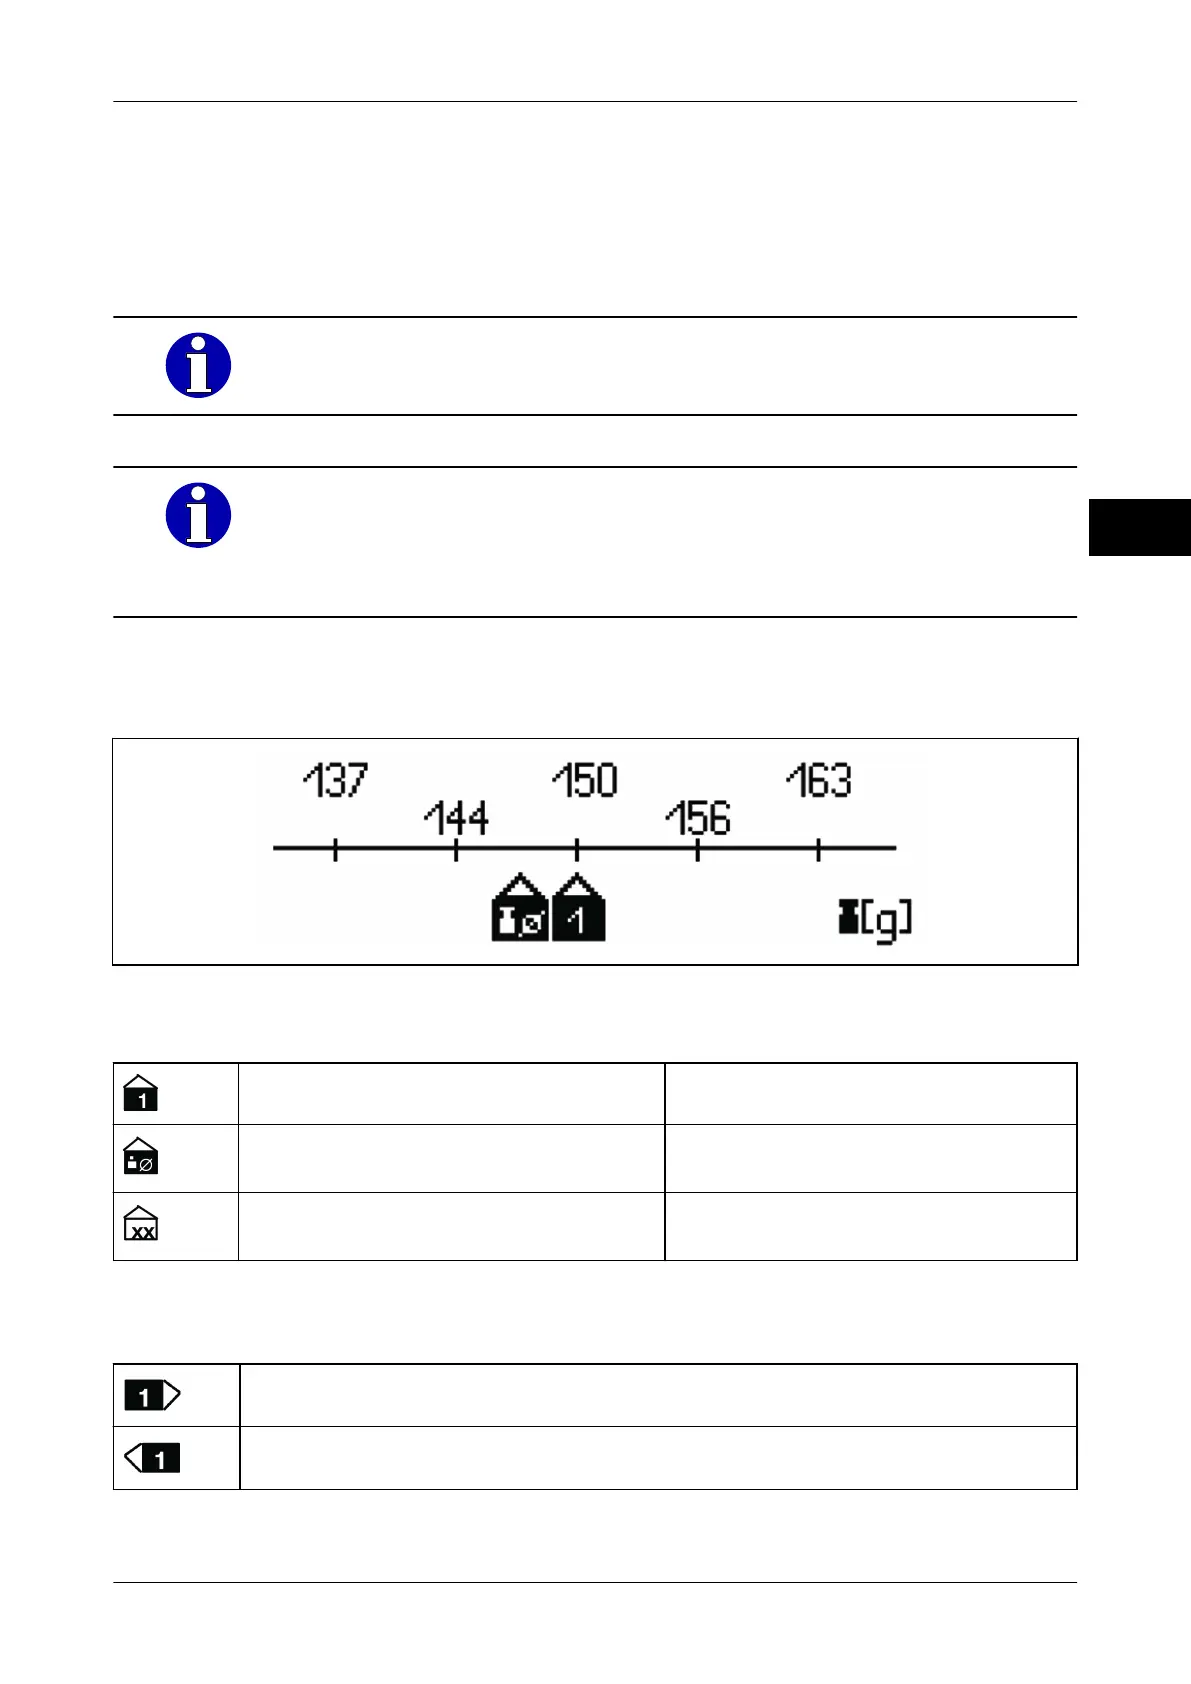
The analog display indicates weights and average weight values with a needle on a scale.
Illustration 48: Example of an analog display
The needles are activated via softkeys and indicate the following weights:
<Current nom.weight Qn> Weight of the last weighed package.
<Mean value chckedPckg.> Average value of all packages
checked.
<Mean value n pckg.> Average value of a preset number n
of last weighed packages
.
If the current weight exceeds the displayed weight range, the following needles are used
for the display:
Current weight is higher than display range.
Current weight is lower than display range.